
What’s Driving Turkey’s Stock Rally?
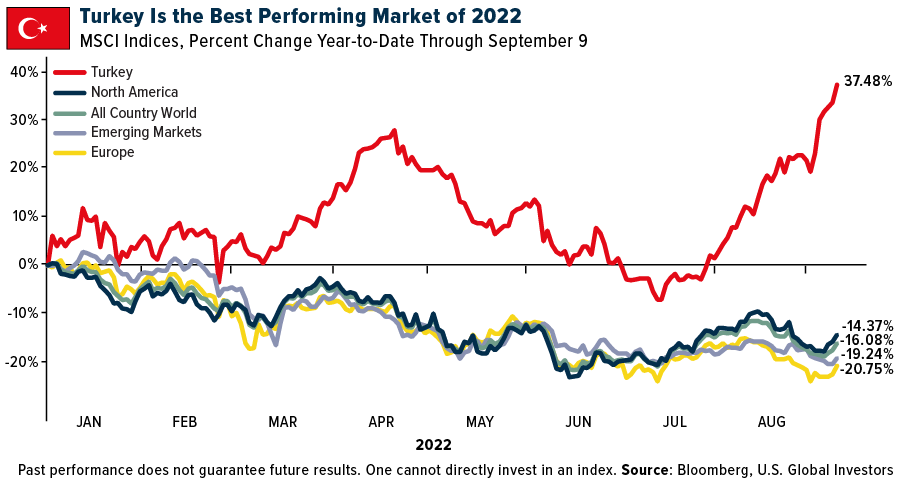
Stocks trading in Turkey were up an impressive 37% for the year as of Friday, September 9, making them the best performing equities market relative to other global markets.
Stocks trading in Turkey were up an impressive 37% for the year as of Friday, September 9, making them the best performing equities market relative to other global markets. Given that most regions are still underwater in 2022—including North America, Europe and emerging markets as a whole—investors may ask what’s behind the Turkey rally.

Let’s start with the facts. Turkey is facing record-high inflation right now, with consumer prices up a jaw-dropping 80% in August compared to the same month last year. President Recep Erdogan, who enjoys unorthodox control over the country’s monetary policy, responded by cutting the interest rate to 13% from July’s 14%.
This isn’t the expected way to address inflation, as you probably know. To combat surging prices, policymakers at central banks ordinarily raise, rather than lower, borrowing costs, which can have the desired effect of slowing demand. The U.S. fed funds rate, for instance, has been hiked four times so far this year, with another increase all but guaranteed after the Labor Department’s report showing that annual inflation remained at 40-year highs in August. Earlier this month, the European Central Bank (ECB) made the biggest rate hike in its history, raising it to 0.75%.
But Turkey’s Erdogan is different. He would prefer to keep the economy chugging along unabated, and so the benchmark rate is currently down approximately 600 basis points (bps) from August 2021, and down a whopping 1,100bps from June 2019.
Trying to Beat Inflation in a Low-Yield Environment
This, I believe, is the main contributing factor to Turkey’s blistering stock rally. Turkish investors appear to be plowing money into the country’s equities in an effort to beat inflation, perhaps with little regard for the fundamentals. Monetary policy is being loosened at the moment, so government bonds won’t do the trick. (Falling interest rates tend to make bond prices rise and yields drop.)
Again, these are the facts: The yield on Turkey’s 10-year bond is currently trading at around 10%, well below the 80% inflation rate. A number of Turkish stocks, meanwhile, have increased over 100%, 200% and even 300% year-to-date in U.S. dollar terms, despite historically high inflation. Where is a Turkish investor to put his or her money?
It’s not just local investors who are participating. Historically, foreign investors have made up a small minority share of total investors in Istanbul-listed stocks, but according to Bloomberg, many of them ramped up their purchases of Turkish stocks in August at the fastest pace since November.
Extremely Low Valuations for Financials
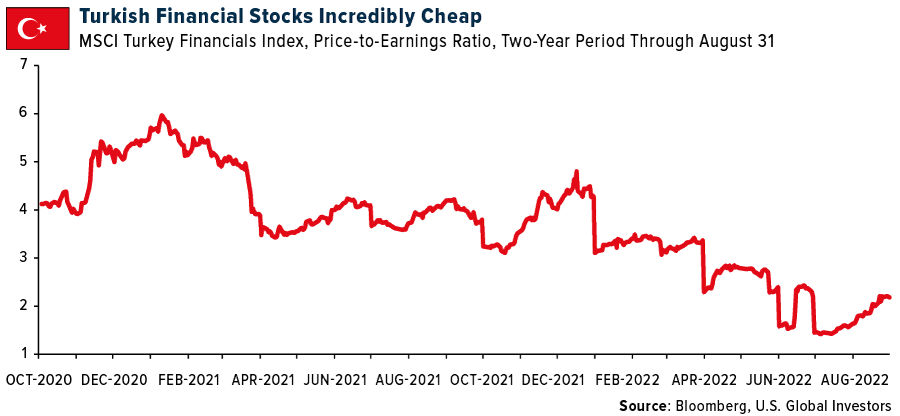
Another catalyst for the rally could be that Turkish stocks are incredibly cheap right now on a price-to-earnings (P/E) basis. According to JPMorgan, Turkey is currently the cheapest market in the entire CEEMEA (Central & Eastern Europe, Middle East and Africa) region. That’s especially true of Turkish banks and financial firms, which had an ultra-low P/E of 2.2 at the end of August, down from a recent high of 6.0 at the beginning of 2021.

Turkish banks have been in the news in recent months, with at least five of them agreeing to adopt Russia’s Mir payments system following the country’s removal from SWIFT (Society for Worldwide Interbank Financial Telecommunications) in response to its invasion of Ukraine. Although Turkey initially criticized Russian President Vladimir Putin for the move, it has refrained from imposing sanctions on the country similar to the U.S. and Europe. In early August, President Erdogan predicted that Turkey’s payment in Russian rubles for imported Russian energy would be a great source of financial support for both countries.
He wasn’t wrong. Many Turkish banks had a phenomenal June quarter. Yapı Kredi—the country’s fourth largest bank and a holding in our Emerging Europe Fund (EUROX) as of June 30, 2022—reported $1.3 billion in net income in the first half of 2022, an approximately 180% increase over the same six-month period a year earlier. Yapı Kredi was up 96.08% for the year as of September 9.
See the top 10 holdings in EUROX by clicking here.
Get to Know EUROX
In fact, among the best performing companies in EUROX for the year were those that are domiciled in Turkey. Besides Yapı Kredi, there’s oil refiner Turkiye Petrol Rafinerileri, up 57.64%, and industrial conglomerate Koc Holding, up 30.70%.
As of June 30, Turkey had the third biggest weighting in EUROX after Poland and Hungary, representing about 14% of the fund. We were very early in divesting from Russian equities in February of this year, soon after the invasion, and this helped fund performance relative to its benchmark, the MSCI EM Europe 10/40 Index. For the first half of the year through June 30, EUROX had a negative return of 47.19%, significantly beating the benchmark, which fell 74.17%.
Click here to learn more about EUROX.
Please click here to see the EUROX prospectus.
Foreside Fund Services, LLC, Distributor. U.S. Global Investors is the investment adviser.
Total Annualized Returns as of 6/30/2022:
| Fund | One-Year | Five-Year | Ten-Year | Gross Expense Ratio |
|---|---|---|---|---|
| Emerging Europe Fund (EUROX) | -46.27% | -9.72% | -6.78% | 2.49% |
| MSCI EM Europe 10/40 Index | -74.41% | -19.19% | -11.18% | N/A |
Performance data quoted above is historical. Past performance is no guarantee of future results. Results reflect the reinvestment of dividends and other earnings. For a portion of periods, the fund had expense limitations, without which returns would have been lower. Current performance may be higher or lower than the performance data quoted. The principal value and investment return of an investment will fluctuate so that your shares, when redeemed, may be worth more or less than their original cost. Performance does not include the effect of any direct fees described in the fund’s prospectus which, if applicable, would lower your total returns. Performance quoted for periods of one year or less is cumulative and not annualized. Obtain performance data current to the most recent month-end at www.usfunds.com or 1-800-US-FUNDS.
Mutual fund investing involved risk. Principal loss is possible. Stock markets can be volatile and share prices can fluctuate in response to sector-related and other risks as described in the fund prospectus. Foreign and emerging market investing involves special risks such as currency fluctuation and less public disclosure, as well as economic and political risk. By investing in a specific geographic region, a regional fund’s returns and share price may be more volatile than those of a less concentrated portfolio. The Emerging Europe Fund invests more than 25% of its investments in companies principally engaged in the oil & gas or banking industries. The risk of concentrating investments in this group of industries will make the fund more susceptible to risk in these industries than funds which do not concentrate their investments in an industry and may make the fund’s performance more volatile.
The MSCI Turkey Index is designed to measure the performance of the large and mid-cap segments of the Turkish market. With 12 constituents, the index covers about 85% of the equity universe in Turkey. The MSCI North America Index is designed to measure the performance of the large and mid-cap segments of the US. and Canada markets. With 716 constituents, the index covers approximately 85% of the free float-adjusted market capitalization in the US and Canada. The MSCI All Country World Index (ACWI) is a stock index designed to track broad global equity-market performance. Maintained by Morgan Stanley Capital International (MSCI), the index comprises the stocks of nearly 3,000 companies from 23 developed countries and 25 emerging markets. The MSCI Emerging Markets Index captures large and mid-cap representation across 24 Emerging Markets (EM) countries. The MSCI Europe Index is a stock market index that measures the performance of large and mid-cap companies across developed countries in Europe. With 432 constituents, the index covers approximately 85% of the market capitalization across developed countries in the European region. The MSCI Turkey/Financials Index is a free-float weighted equity index. It was developed with a base value of 100 as of December 31, 1998. The MSCI Emerging Europe 10/40 Index is a free float-adjusted market capitalization index. The MSCI Emerging Markets (EM) Europe 10/40 Index is designed to measure the performance of the large and mid-cap representation across 6 Emerging Markets (EM) countries in Europe.
The price-to-earnings ratio (P/E ratio) is the ratio for valuing a company that measures its current share price relative to its earnings per share (EPS). Basis point (BPS) refers to a common unit of measure for interest rates and other percentages in finance. One basis point is equal to 1/100th of 1%, or 0.01%, or 0.0001, and is used to denote the percentage change in a financial instrument.
Fund portfolios are actively managed, and holdings may change daily. Holdings are reported as of the most recent quarter-end. Holdings in the Emerging Europe Fund as a percentage of net assets as of 6/30/2022: Yapi ve Kredi Bankasi AS 2.48%, Turkiye Petrol Rafinerileri AS 2.16%, Koc Holding AS 3.04%.
All opinions expressed and data provided are subject to change without notice. Some of these opinions may not be appropriate to every investor.


