
What Is the Semiconductor CHIPS Act, and Why Does the U.S. Need It?
The bipartisan Creating Helpful Incentives to Produce Semiconductors for America Act, or CHIPS Act, was signed into law this week, setting aside $52 billion to boost domestic semiconductor research and production.
We believe government policy is a precursor to change, and if that’s the case, we may soon see a big shift in the U.S.’s global market share of semiconductor chips. These integrated circuits are the hidden brains of nearly everything that fills our lives nowadays, from vehicles to smartphones, TVs, washing machines and even diapers. Without them, nothing would function.
Global demand for chips is growing at an alarming rate and will only accelerate further as more and more devices are designed to be “smart” and connected. According to ASML, the world’s leading supplier to the chip industry, there are an estimated 40 billion connected devices right now, and by 2030, this number is expected to increase to a jaw-dropping 350 billion.
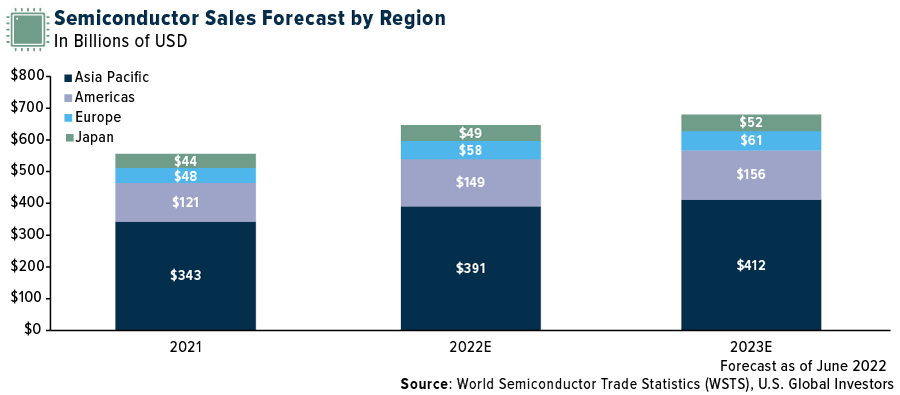
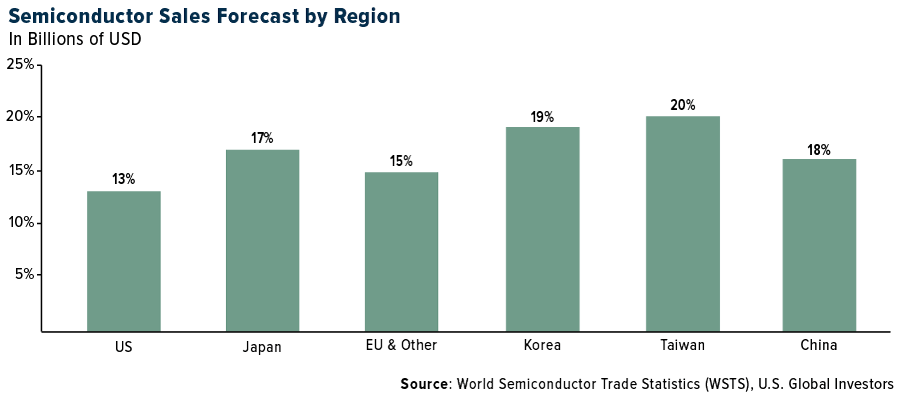
Put another way, the worldwide semiconductor market is forecast to increase 16.3% this year, which would be the second straight year of double-digit growth, says the World Semiconductor Trade Statistics (WSTS). In 2023, growth is expected to be a more moderate 5.1%.
Semiconductor Use in Automobiles
Consider the growth in automobiles’ chip use alone. In 2021, each new vehicle contained close to 300 different semiconductors, a massive 40% increase from just two years earlier, according to research by Goldman Sachs.

This is due in large part to the expansion of electric vehicles (EVs), advanced driver assistance systems (ADAS) and other technologies. A Tesla Model 3, for instance, is estimated to use more than twice the number of chips as an internal combustion-powered vehicle.
CHIPS Act Designed to Address Supply Chain Vulnerabilities
As you likely know, the pandemic lockdowns of 2020 exposed huge supply chain vulnerabilities for a number of goods coming into the U.S., including semiconductors. Without fresh chips, most automakers have been forced to cut production. According to Automotive News, the North American market was short as many as 100,000 new vehicles in the week ended August 7, thanks to the ongoing chip shortage.
This has driven up demand (and prices) for used cars and trucks. The Manheim Used Vehicle Value Index shows that, despite a slight decrease from June to July, preowned auto prices in the U.S. were up 12.5% on average in July from the same month last year.
The $52 billion CHIPS Act, signed by President Joe Biden on Tuesday, is designed to address these supply chain vulnerabilities, incentivize the construction of new semiconductor manufacturing facilities and compete with other countries’ heavily subsidized industries.
To be clear, the U.S. is no slouch in this department. Semiconductors rank as the nation’s fifth largest export, and U.S. companies represent seven of the top 10 global chipmakers by market cap.
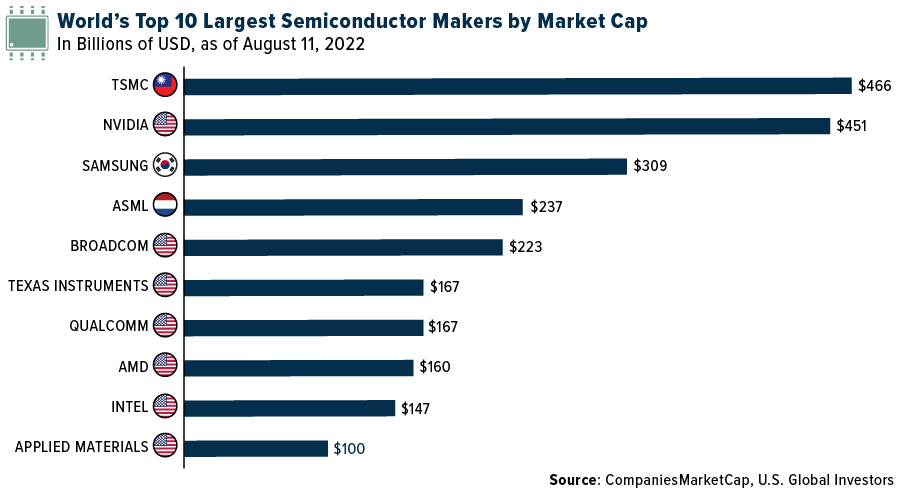
Nevertheless, the U.S. today represents only 12% of global semiconductor manufacturing capacity, despite the technology being invented in the U.S. That’s according to Keith Jackson, president and CEO of the Semiconductor Industry Association (SIA). Jackson rightfully added that chip technology is “strategically important to our economy and national security.”
If you refer back to the first chart in this piece (“Semiconductor Sales Forecast by Region”), it’s clear the momentum has been gaining for overseas manufacturers. That’s particularly true for Korea’s Samsung and Taiwan’s TSMC, whose largest customer is none other than Apple. In 2021, the iPhone maker accounted for over a quarter of TSMC’s total annual revenue of $57 billion.
The CHIPS Act isn’t the only incentive U.S.-based manufacturers are getting. Just two days after the legislation was signed into law, New York committed an additional $10 billion in corporate tax breaks for chipmakers who build or expand semiconductor fabrication plants, or “fabs,” within the state.
Although nothing has been announced yet, it’s possible that other states may roll out similar tax incentives to relocate within their borders.
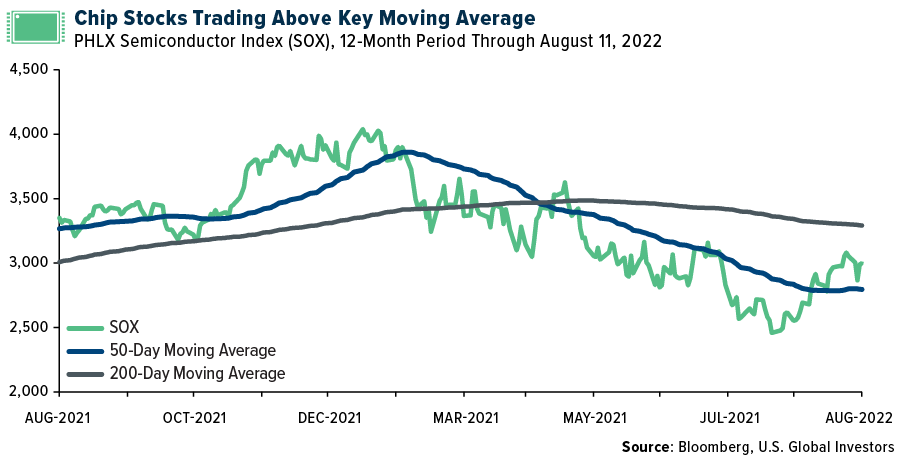
Shares of the top 30 largest U.S. chipmakers, as measured by the PHLX Semiconductor Index (SOX), have responded positively in anticipation of the law’s passage. This week marks the sixth straight week that SOX has recorded a positive gain, and the index is now back to trading above its 50-day moving average. As of Friday, shares were still about 24% below their all-time close high on December 27 of last year, so it appears there could be plenty of upside potential.
Although U.S. Global Investors doesn’t necessarily have a semiconductor chip strategy, we acknowledge that—as I mentioned before—every device and sector use them. That includes our key disciplines, such as gold and precious metal mining, airlines, container shipping and even luxury goods (Tesla and Apple).
Do you YouTube? If you haven’t done so already, be sure to subscribe to our channel by clicking here!

Index Summary
- The major market indices finished up this week. The Dow Jones Industrial Average gained 2.92%. The S&P 500 Stock Index rose 3.25%, while the Nasdaq Composite climbed 3.08%. The Russell 2000 small capitalization index gained 4.93% this week.
- The Hang Seng Composite lost 0.15% this week; while Taiwan was up 1.68% and the KOSPI rose 1.49%.
- The 10-year Treasury bond yield remained flat this week at 2.838%.
Airlines & Shipping
Strengths
- The best performing airline stock for the week was Azul, up 23.4%. The International Air Transport Association (IATA) recently reported June passenger travel data. The recovery in international markets was a highlight, while domestic travel numbers remained strong, as expected. Total industry load factors were 82.4% in June, with both domestic and international levels over 80% for the first time since the recovery from the pandemic. In June, European international air travel was at 80% of pre-Covid levels, while Asia Pacific was at just 30%. For domestic markets, the industry is at 85% of pre-Covid levels, led by the U.S. and Brazil.
- World trade is staying surprisingly robust with China’s July external port volumes up 14.7% year-over-year and U.S. July imports up 23% versus 2019, helped by seasonal toy and clothing flows. Pockets of logistics disruptions are flaring up (U.S. east coast, U.S., and the EU inland) but overall congestion is lower than the first quarter. Taiwan military drills could cause some temporary disruption.
- The U.S. Department of Transportation (DOT) proposed new rules to strengthen passenger protection, suggesting that airlines provide vouchers that are valid indefinitely when passengers are unable to fly due to pandemic-related reasons. Last week, Transportation Secretary Pete Buttigieg announced the proposed rules would ensure airline passengers receive timely refunds and codify the DOT’s longstanding interpretation that failing to provide refunds due to delays or cancellations is unfair practice.
Weaknesses
- The worst performing airline stock for the week was Sun Country, down 4.9%. Virgin Australia, Qantas, and Air New Zealand have been named among the global airlines with the current highest cancellation rates, while Singapore Airlines was noted as the carrier with the lowest cancellation figure. According to new data compiled by aviation analytics company Cirium, which looked at flight data from 19 major airlines in the three months to July 26, Virgin Australia had one of the highest cancellation rates at 5.9%. Meanwhile, Air New Zealand and Qantas were also named in the top five airlines with high cancellation rates.
- Commentary from the Ningbo Containerized Freight Index (NCFI) said that the European market “remain oversupplied” and that freight rates “continue to decline.” “Carriers are definitely beginning to struggle to fill their ships for North Europe and are sailing light,” one China-based NVOCC told The Loadstar this week. Spot rates from Asia to the U.S. West Coast are continuing to decline; for example, the XSI recorded an 8% drop this week, to $6,353 per 40ft, representing a fall of some 60% on the short-term market rates of a year ago.
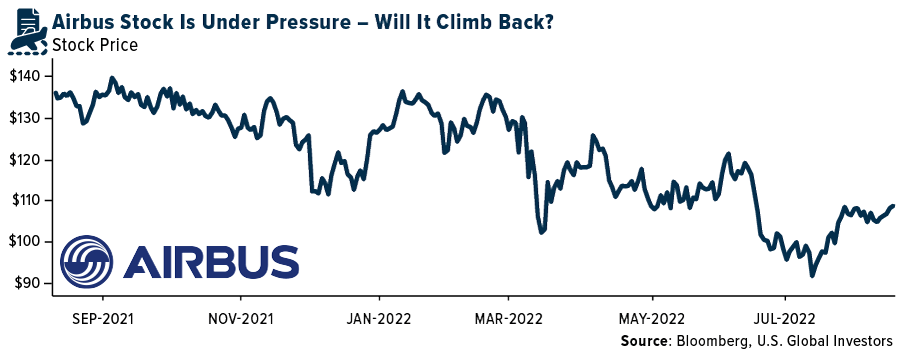
- According to Goldman Sachs, Airbus’ July deliveries came in-line with recent Reuters indications but equates to one of the lowest July seasonality on record. This is unsurprising given the latest change to the ramp-up plans on the A320, which now implies a more back-end-loaded.
Opportunities
- Airlines’ third quarter 2022 outlooks are pointing to a better pricing outlook and lower jet fuel costs, at least for the near term, reports Goldman Sachs. The bank notes that consensus will need to revise estimates upward for both current and upcoming years to reflect such trends.
- According to JPMorgan, Evergreen’s better-than-peer financial performance contrasted with its much-worse-than-peer price performance, resulting in the company’s most compelling valuation with EV/EBITDA at only 0.7x versus the sector average of 4.6x. It is worth noting that Evergreen’s underwhelming price performance is not driven by capital reduction, as there was a comparable price drop with other Taiwanese liners including Yang Ming and Wan Hai. Further, tensions at the Taiwan Straits may add further disruptions to shipping operations, to potentially aggravate the supply chain woes and provide upward support for freight rates.
- Airline traffic in Mexico continues to perform well, unceasingly surprising the market to the upside. Leisure and VFR routes are clearly outperforming. However, a more relevant rebound on corporate routes, such as Monterrey and Guadalajara, are supporting the traffic improvement for the coming quarters. There are potential macroeconomic risks that could impact demand, especially on the international front, which is broadly dependent on the U.S.
Threats
- Following recent headlines of union strike action, Lufthansa revealed that it is now in talks with three of the main unions for the German mainline – pilots, cabin crew and ground staff. Though ground staff in Germany walked out last week leading to 1,000 flights being cancelled, management revealed that it believes they are close to an agreement. For pilots, the talks center on not only pay, but also the strategy at Lufthansa. Management is open to renegotiating the terms of its old agreement which limited the shift of capacity to new lines, but they will not move away from their strategy overall, as it is key to the company’s transformation plans and competitiveness in leisure markets.
- Waning demand in Europe and the U.S. could soon have the container market going into a” downward spiral,” Sea-Intelligence predicts in its latest Sunday Spotlight. The analyst firm has reviewed the latest figures from Container Trade Statistics, especially noting weak demand on the European market. Import volumes declined in June by 9% compared to the same month last year, with export growth negative for the ninth month in a row. Sea-Intelligence states that European import demand has been negative in 22 out of the last 30 months.
- One in five Ryanair flights this summer are being delayed by air-traffic control providers – at least that’s the claim from the chief executive of the airline’s main operation. Eddie Wilson, CEO of Ryanair DAC, told The Independent, “The major factor that’s affecting all markets, whether you have enough staff or you’re an airline that doesn’t have enough staff, is air-traffic control [ATC]. It is the culprit.” Wilson said the carrier “planned better” and has the right amount of people, but still, “we will have delays this summer because of air-traffic control.” It is taking 20% or more out of Ryanair’s punctuality.
Emerging Markets
Strengths
- The best performing country in emerging Europe for the week was Poland, gaining 4.8%. The best performing country in Asia this week was the Philippines, gaining 4.6%.
- The Polish zloty was the best performing currency in emerging Europe this week, gaining 1.6%. The Pakistani rupee was the best performing currency in Asia this week, gaining 4.3%.
- Prices in China are not increasing as rapidly as in other regions of the word. CPI in China was released at 2.7% on a year-over-year basis compared to 2.5% in June, while global inflation is at 9.8%. China’s producer price index (PPI) in July declined to 4.2% from 6.1% in June. The Asian nation continues to focus on its goal to keep inflation low and the job market stable.
Weaknesses
- The worst relative performing country in emerging Europe for the week was Hungary, gaining 0.53%. The worst performing country in Asia this week was Hong Kong, losing 0.12%.
- The Turkish lira was the worst performing currency in emerging Europe this week, losing 0.15%. The Indian rupee was the worst performing currency in Asia this week, losing 0.32%.
- Inflation in central emerging Europe continues to move higher. In Hungary, inflation spiked to 13.7% in July from 11.7% in June on a year-over-year basis. In the Czech Republic, CPI jumped to 17.5% from 17.2%. In Poland, inflation reached 15.6%, a level last seen in 1996.
Opportunities
- Bloomberg reported that China’s initial public offering (IPO) activity remains robust while drying up in other markets. IPO activity on mainland exchanges climbed to $57.8 billion year-to-date, the largest ever for such a period. China has had five IPOs above $1 billion since January, compared with just one in New York and Hong Kong, and one in London.
- This week, economic data for the Eurozone came out better than expected. Industrial production increased 2.4% on a year-over-year basis, versus 1.2% expected. The Investors’ Confidence Index still remains in negative territory, but it was reported at -25.2, above the forecasted reading of -29.0. Next week the expectation of economic growth for the euro-area will be announced and it too could surprise to the upside.
- On August 18, the final July core inflation for the Eurozone will be released. Bloomberg economists expect the core inflation (excluding food and energy) to remain unchanged at 4%. However, they do see a small increase in CPI to 8.9% from the prior 8.6%.
Threats
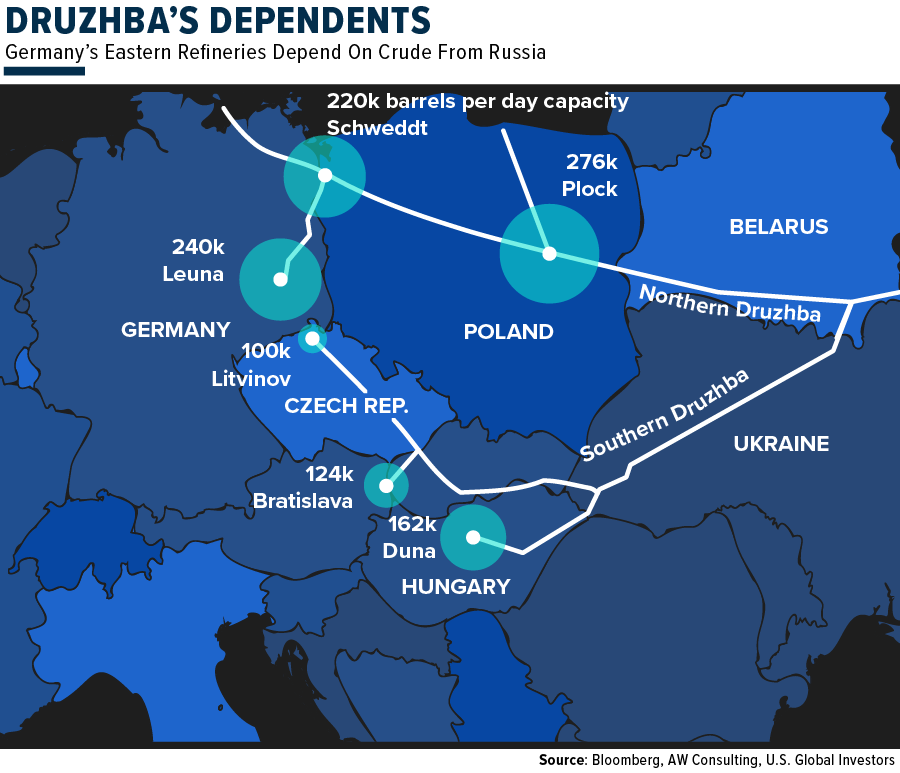
- Russia temporarily suspended oil shipments to Europe via the Druzhba pipeline due to problems with payments. The cut-off mostly impacted the Czech Republic, Hungary, and Slovakia as they rely heavily on imports via the Druzhba pipeline. The flow of oil was already restored, but Europe remains dependent on oil from Russia – meaning any oil flow disruption puts more pressure on the energy sector in the region.
- Ukraine’s air force said Wednesday that nine Russian warplanes were destroyed at an air base in Crimea. If confirmed that Ukraine attacked the air base, this could lead to a significant escalation of the war, as it would be the first known major attack on a Russian military site on the Crimea Peninsula, which was annexed by Russia in 2014. Russian warplanes have used this air base to strike areas in Ukraine’s south region.
- More Baltic states have abandoned cooperation with China. This week, Estonia and Latvia followed Lithuania’s steps to withdraw its cooperation with China, cutting down the group to 14 members. The group was created in 2012 (Greece joined in 2019) to strengthen the ties between eastern Europe and China, promoting infrastructure and development projects. However, Russia’s invasion of Ukraine already started to affect international economic cooperation.

Energy & Natural Resources
Strengths
- The best performing commodity for the week was lumber, up 22.85%, as West Fraser Timber announced reductions in output from two of its mills. The supply cut is equivalent to 2.5% of North American capacity. Iron ore climbed this week as better-than-expected trade figures and falling steel stockpiles boosted hopes that demand will improve. The steel-making ingredient rose as much as 4% in Singapore to claw back some of last week’s declines. Surprisingly, strong exports from China — and a record trade surplus – eased concerns over China’s economic recovery, although significant headwinds remain.
- European natural gas prices dipped to the lowest level in two weeks as fuel held in storage facilities across Europe edged above the seasonal norm. Benchmark gas declined as much as 2.9%, sliding for a third session. The continent’s storage sites are 72% full, compared to the average for the previous five years of 70.1%, data from Gas Infrastructure Europe show.
- In July, Permian production averaged 14.6 billion cubic feet per day (Bcf/d), above the June average but below the May average. The growth was largely observed in the second half of July, with production averaging 14.82 Bcf/d over the 14 days ending August 1, up from the two-week average prior to that of 14.45 Bcf/d (and the highest two-week average since May).
Weaknesses
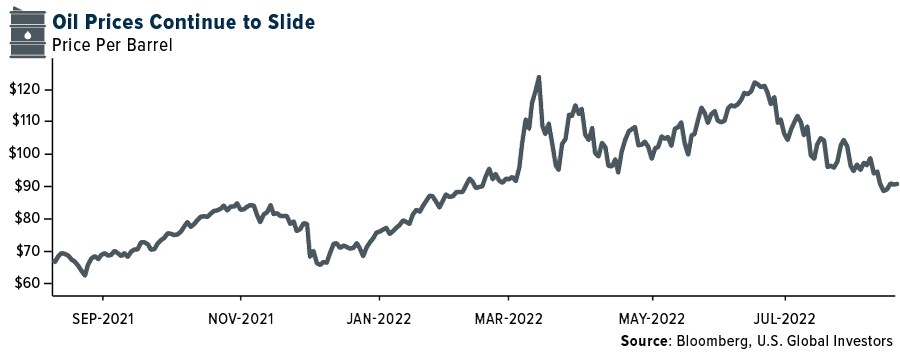
- The worst performing commodity for the week was uranium, as proxied by the Sprott Physical Uranium Trust, which was down 5.09% on little headline news. Oil prices touched six-month lows this week. Concerns around oil demand continue to dominate after the weak U.S. gasoline demand number in the Department of Energy’s report earlier this week, and as central banks continue to raise rates forcefully.
- Fertilizer prices are declining. U.S. DAP prices are down $10 per ton to $695-700 per ton. In the U.S., demand remains seasonally slow, and summer fill demand has been moderate whereas supply is on the rise, with four cargoes from Russia expected to arrive at U.S. ports over the coming weeks.
- The German government decided to impose a temporary gas levy on natural gas consumption (timeframe 1 October 2022 – 1 April 2024), to cope with costs caused by the reductions in Russian gas supplies. There will be monthly settlements, and the levy may be adjusted every three months. If Russia resumes normal contractual supply volumes, the levy will be reduced to zero. The levy amount is due to be announced on August 15. This could come to hundreds of euros per year, up to €1,000, for the average household, depending on gas use.
Opportunities
- While the restart of Nord Stream 1, following a maintenance closure, alleviated concerns of a permanent shutdown to the pipeline, utilization remains low at 40% of capacity, impeding Germany’s ability to replenish storage levels before the winter heating season. LNG markets have remained tight throughout this year on the back of increased export demand from Europe, following Russia’s invasion of Ukraine paired with limited export capacity out of the U.S., which was further exacerbated by the full shutdown of Freeport LNG after an explosion at the plant in June.
- The Inflation Reduction Act includes the largest federal investment in renewable energy, EVs and industry efficient initiatives which should boost the attractiveness of these sectors for investment. In addition, metals being sourced from the U.S. versus abroad could open key mining projects in America to extract lithium, copper, and nickel as there will be tax advantages to incentivize the investment and supply chain concerns to address.
- Elevated oil prices have been great news for the leveraged shale drillers Bloomberg reports. With their improved cash flow, they have been able to pay down debt faster than anticipated which will free up cash for dividends or stock buybacks going forward. Even with the recent pullback in oil prices, that ability to work with an unencumbered balance sheet allows for more corporate flexibility.
Threats
- Fifty percent of EU chemical sales are derived from three end markets, 1) consumer/food (25% of sales on an unweighted basis), 2) transportation (15%), and 3) construction (13%). So far through the second quarter, most chemical companies have indicated that there are limited signs of a slowdown in end markets. However, looking at what companies in these key product categories have communicated in the second quarter suggests that demand is weakening, particularly in construction.
- With the recent introduction of the Inflation Reduction Act, one of the proposals is a 15% AMT (alternative minimum tax). This would limit the ability of companies to use historically generated NOLs (net operating losses) to fully offset cash taxes – something which was topical through earnings season. Notably, most large cap companies are already full cash taxpayers (or will be by next year) and would not be impacted by the proposed legislation.
- Strategic Petroleum Reserve crude oil inventories last week fell to 469 million barrels, the lowest level since May 1985, according to data from the Department of Energy. Withdrawals for the week were 4.6 million barrels, the smallest weekly withdrawal since May. SPR inventories stood at 618 million barrels last September, declining since then due to congressionally mandated sales and emergency releases authorized by the Biden administration to address rising commodity prices.
Luxury Goods
Strengths
- Annual inflation in the United States has decreased. For the month of August, it was reported at 8.5%, lower than the previous month’s 9.1% and lower than consensus. Inflation directly impacts consumer spending habits because prices increase and purchasing power decreases – in the United States, one of the leading luxury goods markets in the world other than China. If inflation begins to decrease, purchasing power should start to increase steadily.
- According to Business Insider, despite historical inflation levels worldwide, the rich continue buying luxury goods, reflected in the strong reporting results of iconic companies such as LVMH, Kering, Ferrari, Prada, and Hermès. For example, Kering (Gucci, Yves Saint Laurent, Bottega Vaneta) and LVMH (Louis Vuitton, Christian Dior, Fendi, Celine) reported over 20% increases in revenue in the first quarter, compared with last year.
- Brilliant Earth Group, a California-based designer and manufacturer of jewelry products, was the best performing S&P Global Luxury stock for the week, gaining 23.09%. The company reported great second quarter results this week. Its net sales increased 17.8%, with its share price rising around 30%.
Weaknesses
- Annual inflation in China has increased. For the month of August, it was reported at 2.7%, higher than the previous month’s 2.5% and lower than consensus. An increase in inflation in the Asian nation represents an overall decrease in the purchasing power of China’s population, the world’s number one luxury goods market.
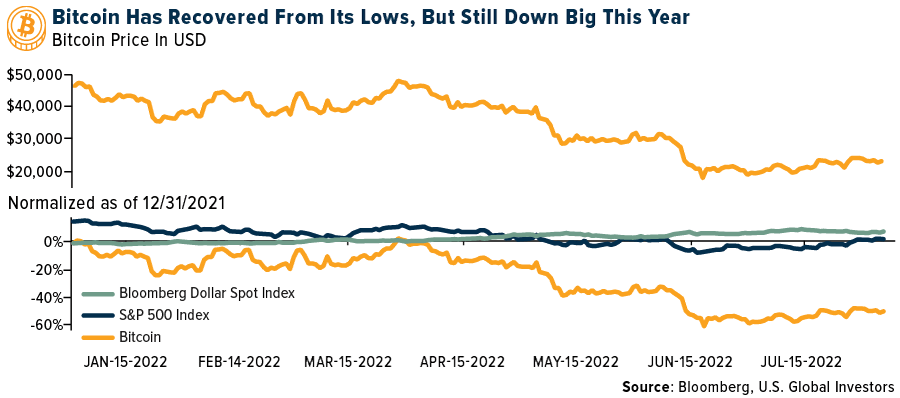
- The adoption of cryptocurrencies as a payment method has opened a new category of clients for many brands. One of the top luxury markets exposed to this type of payment method are luxury watches such as Rolex, Audemars Piguet, etc. According to Bloomberg, Chrono24, the world’s largest second-hand watch marketplace, has more than a half million luxury watches on its website due to the collapse in crypto. This high availability has driven prices down.
- Shiseido Company, a multinational cosmetic company founded in Tokyo, was the worst performing S&P Global Luxury stock for the week, losing 3.87%. Shares fell 6.2% this week after the company announced a cut in its forecast for the remainder of the year.
Opportunities
- Popular American fashion brand Ralph Lauren reported this week that revenues increased by 8% to $1.5 billion for the first quarter, reports Vogue Business. The gain was driven by a rebound of in-store sales and strong performances in both Europe and Asia, the article explains. Profit rose 3.3% over last year, the luxury brand noted, with North America revenue increasing 6% and Europe revenue increasing 17%
- According to Nikkei Asia, Jakarta and Bangkok, in the next five years, will be the host of more than 50 luxury hotels. Thirteen four-star and higher hotels are planning to open in Jakarta between 2021 and 2026, and Bangkok will host 28 four-star and 13 five-star hotels in the same period. Marriot International will open a Ritz-Carlton in 2023.
- Payment of luxury vehicles is changing due to emerging technology and the creation/use of cryptocurrency. According to Bloomberg, AutoCoinCars, a U.K. platform that allows people to buy and sell luxury cars using crypto, doubled its sales to $12 million last year. According to its COO, more than 50% of wealthy crypto holders buy luxury cars such as Lamborghinis because it is less volatile than crypto.
Threats
- Moscow’s cut its gas supplies to Germany by 80%, and the potential total suspension of the supply, is impacting the global economy and industries where the production process depends on gas as a vital energy source. According to Bloomberg, Heinz-Glaz, one of the world’s biggest glass perfume bottle producers for luxury brands (one of its main clients is French group L’Oreal), is facing a complex situation. They produce around 70 tonnes of small glass battles daily, and to replace gas, they need the equivalent of 3,000 football fields of solar panels.
- China reported more than 2,000 new Covid cases on Wednesday, the most since May 12. The Hainan province posted the most with 1,364, and Xinjiang with 380 after a new cluster was found there (NHC). Tibet found 68 new cases just as authorities ordered the construction of up to 3,000 hospital beds, reports Bloomberg. Cases were also found in Zhejiang and Guangdong provinces.
- A semiconductor shortage worldwide is continuing, and prices are increasing too. The recent tension between China and Taiwan (one of the world’s major semiconductor producers) is reflected in the missile test by both countries and the intention of Taiwan to block China from getting its know-how in the industry and developing a successful one. The shortage of critical materials on both sides is a significant threat for well-known luxury brands whose production processes need semiconductors to be finished. This includes names like Apple and Tesla, along with other global technology companies.
Blockchain & Digital Currencies
Strengths
- Of the cryptocurrencies tracked by CoinMarketCap, the best performer for the week was Celsius, rising 89.99%.
- Ether hit more than a two-month high as the planned software upgrade to the Ethereum blockchain underwent a major test, potentially paving the way for one of the most significant changes in the cryptocurrency sector. The Goerli test, conducted late Wednesday New York time, was a kind of rehearsal for switching the Ethereum network from proof-of-work to a more energy-efficient, proof-of-stake system. The full shift is expected next month, writes Bloomberg.
- Huobi Group founder Leon Li is in talks with a clutch of investors to sell his majority stake in the crypto exchange at a valuation of as much as $3 billion, in what could be the industry’s largest takeover since a $2 trillion global crypto rout began. The Chinese crypto mogul has held discussions with a raft of financiers, seeking to sell a roughly 60% slice of the company he founded almost a decade ago, writes Bloomberg.
Weaknesses
- Of the cryptocurrencies tracked by CoinMarketCap, the worst performing for the week was ApeCoin, down 7.37%.
- Galaxy Digital Holdings said its second-quarter loss more than doubled against a backdrop of digital asset price declines. The next comprehensive loss was $554.7 million, compared with $182.9 million in the year-ago, primarily due to unrealized losses on digital assets and on investments in its trading and principal investments business, according to Bloomberg.
- Coinbase Global Inc. posted a record $1.1 billion second-quarter loss and lower-than-expected revenue, as the largest U.S. cryptocurrency exchange was battered by tumbling digital asset prices. Revenue declined by more than 60% to $803.3 million, missing the $854.8 million estimate from analysts, writes Bloomberg.
Opportunities
- Asia crypto exchange Zipmex Pte will allow users to partially withdraw Bitcoin and Ether from their trading accounts starting later this week, providing some relief to those caught by the recent meltdown in the digital asset market. Zipmex will allow users to withdraw part of their Ether and Bitcoin from Zipmex’s Z wallet which means 60% of users will get some of their token back, writes Bloomberg.
- Financial giant Morgan Stanley is looking for a product development manager with a primary focus on building a wide range of new crypto products across business lines, according to a LinkedIn job posting by the firm. The job advert is one indication that Morgan Stanley is taking crypto more seriously and looking to bulk up its product offering after launching a private passive fund in March 2021, reports Bloomberg.
- CryptoQuant plans to nearly triple its headcount by the first quarter of next year, as it pushes ahead with expansion plans despite a sustained slump in cryptocurrency markets, explains Bloomberg. The Seoul-based cryptocurrency data provider is planning to add at least 50 people to its teams in Miami and South Korean capital starting in September, CEO Ju Kiyoung said in an interview.
Threats
- Democratic Senator Elizabeth Warren wants a U.S. regulator to pull its guidance that allowed banks to offer crypto services, seeking more protection for consumers amid heightened volatility for digital assets. Warren is circulating a draft letter to the Office of the Comptroller of Currency among her colleagues and plans to send the final version soon to OCC acting chief Michael Hsu, writes Bloomberg.
- As reported by Bloomberg, widespread adoption of crypto assets in a fully developed metaverse may pose a systemic risk to financial stability and would require “robust consumer protections” framework, staffers at the Bank of England said. The larger the volume of these crypto transactions, the larger the potential impact to real-world financial stability if prices were to collapse, they said.
- Tornado Cash’s token TORN fell sharply on Tuesday after the U.S. Treasury Department imposed sanctions on the cryptocurrency mixer. Tornado Cash was also used to launder funds stolen in the $600 million Ronin Bridge hack in March, as well as the $100 million loot from the Harmony Bridge exploit in June, writes Bloomberg.

Gold Market
This week gold futures closed at $1,817.00, up $25.80 per ounce, or 1.44%. Gold stocks, as measured by the NYSE Arca Gold Miners Index, ended the week higher by 3.12%. The S&P/TSX Venture Index came in up 2.46%. The U.S. Trade-Weighted Dollar fell 0.88%.
| Date | Event | Survey | Actual– | Prior |
|---|---|---|---|---|
| Aug-10 | Germany CPI YoY | 7.5% | 7.5% | 7.5% |
| Aug-10 | CPI YoY | 8.7% | 8.5% | 9.1% |
| Aug-11 | Initial Jobless Claims | 265k | 262k | 248k |
| Aug-11 | PPI Final Demand YoY | 10.4% | 9.8% | 11.3% |
| Aug-14 | Retail Sales YoY | 4.9% | — | 3.1% |
| Aug-16 | Germany ZEW Survey Expectations | -53.8 | — | -53.8 |
| Aug-16 | Germany ZEW Survey Current Situation | -49.8 | — | -45.8 |
| Aug-16 | Housing Starts | 1537k | — | 1559k |
| Aug-18 | Eurozone CPI Core YoY | 4.0% | — | 4.0% |
| Aug-18 | Initial Jobless Claims | 265k | — | 262k |
Strengths
- The best performing precious metal for the week was silver, up 4.78%. A more bullish investment scenario is surrounding the white metal’s industrial uses, such as for solar. Franco Nevada reported second quarter 2022 results this week that were slightly ahead of expectations. Production was 191,000 ounces (5% higher than consensus), resulting in earnings per share (EPS) of $1.02 (above consensus of $0.98). Earnings were supported by lower depreciation and lower share-based compensation.
- Overall, Endeavour Mining reported a solid production beat that was partially offset by higher operating costs with EBITDA slightly ahead of consensus. First half production and costs are tracking well to 2022 guidance and the company increased its dividend. Endeavour reported second quarter production that was ahead of consensus. Cash costs of $824 per ounce for the quarter were 4% above consensus of $793 per ounce, driven by waste stripping and mine sequencing ahead of the rainy season.
- Aya Gold & Silver reported a rise in earnings on Friday, along with a 5% increase in silver production from the prior quarter due to improved grades, strong recoveries, and record throughput for the mill. Advancement and refurbishment of existing operations to expand production are reported as on time and on budget. Exploration is still vital to unlocking the potential of the historic land package which is seeing its first systematic evaluation.
Weaknesses
- The worst performing precious metal for the week was gold, but still up 1.44%. Equinox Gold reported a weaker-than-expected second quarter, reflected in an adjusted EPS loss of $0.16 per share versus expected street consensus of $0.00 per share. Although gold production was in-line with expectations, higher costs pushed the company into the red. In addition, Equinox has guided production lower and costs materially higher for the remainder of 2022.
- Centerra Gold updated its 2022 guidance to reflect the suspension of stacking and leaching activities at Oksut and the shutdown of the gold room at Oksut’s ADR plant. Revised 2022 gold production guidance is 255,000 ounces (versus 425,000 ounces previously), well below the 401,000-ounce consensus, with Oksut now expected to produce 55,000 ounces. As a result, 2022 company-wide cash costs and AISC guidance was revised higher to $700 per ounce and $1,025 per ounce, respectively.
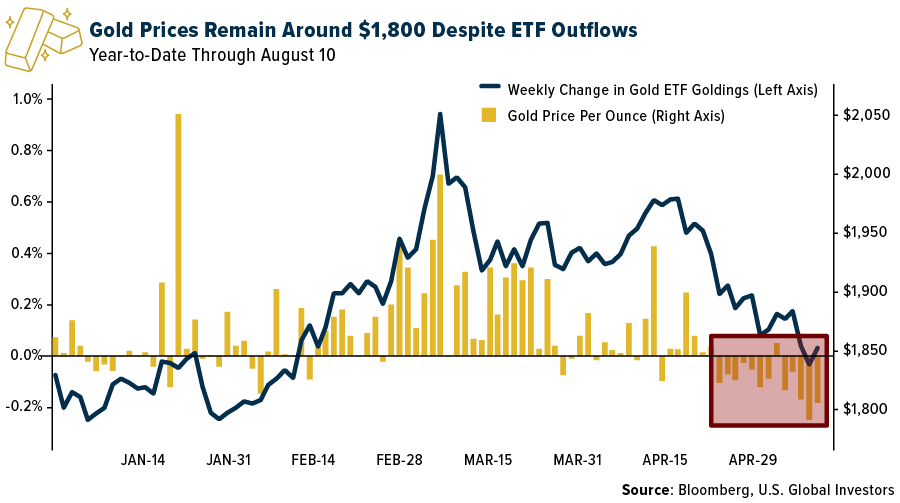
- Gold’s brief rally after cooling U.S. inflation data on Wednesday was lackluster, reports Bloomberg, suggesting that prices might continue to ebb and flow around $1,800 while traders assess recessionary concerns against price pressures. Spot gold has pared all its post-CPI gains, reports Bloomberg, unable to break through the $1,800 level. ETFs have also cut gold holdings for a seventh straight day, but the yellow metal has held near the same price.
Opportunities
- Investor feedback has turned slightly more bullish for gold, citing a combination of factors. These include Fed hikes slowing/peaking, which is mathematically supportive for gold, continued inflation risk, particularly with comments out of the EU overnight, and a continued geopolitical safe-haven bid, (with recent saber rattling in China, ongoing Russian war, and overall economic uncertainty in the EU/China).
- According to JPMorgan, while the real yield correlation with gold prices has broken down in recent weeks, the bank expects a return to the trend over the coming weeks as confidence grows. Geopolitical tensions also continue to support the case for gold, with prices having moved higher by $40 per ounce since U.S. House Speaker Pelosi’s visit to Asia was announced at the end of July.
- Silver has been the worst performer among major precious metals in 2022, but prices may have fallen far enough to spark a modest recovery. The white metal has lost about 11%, weighed down by the stronger U.S. dollar, rising interest rates and slowing growth. But prices could turn higher from later this year as the electronics and photovoltaics sectors support industrial consumption, while retail and jewelry demand look strong, James Steel, chief precious metals analyst at HSBC Securities USA Inc., said in a note.
Threats
- RBC lowered its Equinox Gold price target to C$8 (from C$11) on weaker near-term operations and lower target multiples given elevated execution risk. In RBC’s view, lower output and higher costs across the portfolio could strain the balance sheet amidst construction at Greenstone, where investors are intensely focused on potential for capex overrun given industry-wide inflation.
- Barrick Gold CEO Mark Bristow is sticking with his cost guidance for now, despite inflationary headwinds at mines around the world. He said the idea that industry costs have peaked is wishful thinking. “I don’t think this inflation is going away in a hurry,” Bristow said in an interview after the release of earnings, citing Covid-related nationalism, the lingering impacts of pandemic stimulus and a “completely disparate” geopolitical environment. “Everyone is just wishing inflation away.”
- According to Canaccord Genuity, for IAM Gold, the key focus for investors, in the group’s view, is on progress in addressing the funding gap in the wake of the significant Côté capex increase that was announced with the company’s first quarter results. Canaccord continues to see few desirable options to plug the funding gap. The company is looking at various alternatives to increase liquidity, including asset sales (complete and/or partial), JV partnerships, debt (secured, unsecured, convertible), equity, and extending the gold prepay arrangement.

U.S. Global Investors, Inc. is an investment adviser registered with the Securities and Exchange Commission (“SEC”). This does not mean that we are sponsored, recommended, or approved by the SEC, or that our abilities or qualifications in any respect have been passed upon by the SEC or any officer of the SEC.
This commentary should not be considered a solicitation or offering of any investment product. Certain materials in this commentary may contain dated information. The information provided was current at the time of publication. Some links above may be directed to third-party websites. U.S. Global Investors does not endorse all information supplied by these websites and is not responsible for their content. All opinions expressed and data provided are subject to change without notice. Some of these opinions may not be appropriate to every investor.
Holdings may change daily. Holdings are reported as of the most recent quarter-end. The following securities mentioned in the article were held by one or more accounts managed by U.S. Global Investors as of (06/30/22):
Qantas Airways
Singapore Airlines Ltd.
Airbus SE
Evergreen Marine Corp Taiwan L
Deutsche Lufthansa AG
Ryanair Holdings PLC
Franco Nevada
Endeavour Mining PLC
LVMH Moet Hennessy
Kering
Ferrari NV
Hermes International
Marriot International
Apple
Tesla
*The above-mentioned indices are not total returns. These returns reflect simple appreciation only and do not reflect dividend reinvestment.
The Dow Jones Industrial Average is a price-weighted average of 30 blue chip stocks that are generally leaders in their industry. The S&P 500 Stock Index is a widely recognized capitalization-weighted index of 500 common stock prices in U.S. companies. The Nasdaq Composite Index is a capitalization-weighted index of all Nasdaq National Market and SmallCap stocks. The Russell 2000 Index® is a U.S. equity index measuring the performance of the 2,000 smallest companies in the Russell 3000®, a widely recognized small-cap index.
The Hang Seng Composite Index is a market capitalization-weighted index that comprises the top 200 companies listed on Stock Exchange of Hong Kong, based on average market cap for the 12 months. The Taiwan Stock Exchange Index is a capitalization-weighted index of all listed common shares traded on the Taiwan Stock Exchange. The Korea Stock Price Index is a capitalization-weighted index of all common shares and preferred shares on the Korean Stock Exchanges.
The Philadelphia Stock Exchange Gold and Silver Index (XAU) is a capitalization-weighted index that includes the leading companies involved in the mining of gold and silver. The U.S. Trade Weighted Dollar Index provides a general indication of the international value of the U.S. dollar. The S&P/TSX Canadian Gold Capped Sector Index is a modified capitalization-weighted index, whose equity weights are capped 25 percent and index constituents are derived from a subset stock pool of S&P/TSX Composite Index stocks. The NYSE Arca Gold Miners Index is a modified market capitalization weighted index comprised of publicly traded companies involved primarily in the mining for gold and silver. The S&P/TSX Venture Composite Index is a broad market indicator for the Canadian venture capital market. The index is market capitalization weighted and, at its inception, included 531 companies. A quarterly revision process is used to remove companies that comprise less than 0.05% of the weight of the index, and add companies whose weight, when included, will be greater than 0.05% of the index.
The S&P 500 Energy Index is a capitalization-weighted index that tracks the companies in the energy sector as a subset of the S&P 500. The S&P 500 Materials Index is a capitalization-weighted index that tracks the companies in the material sector as a subset of the S&P 500. The S&P 500 Financials Index is a capitalization-weighted index. The index was developed with a base level of 10 for the 1941-43 base period. The S&P 500 Industrials Index is a Materials Index is a capitalization-weighted index that tracks the companies in the industrial sector as a subset of the S&P 500. The S&P 500 Consumer Discretionary Index is a capitalization-weighted index that tracks the companies in the consumer discretionary sector as a subset of the S&P 500. The S&P 500 Information Technology Index is a capitalization-weighted index that tracks the companies in the information technology sector as a subset of the S&P 500. The S&P 500 Consumer Staples Index is a Materials Index is a capitalization-weighted index that tracks the companies in the consumer staples sector as a subset of the S&P 500. The S&P 500 Utilities Index is a capitalization-weighted index that tracks the companies in the utilities sector as a subset of the S&P 500. The S&P 500 Healthcare Index is a capitalization-weighted index that tracks the companies in the healthcare sector as a subset of the S&P 500. The S&P 500 Telecom Index is a Materials Index is a capitalization-weighted index that tracks the companies in the telecom sector as a subset of the S&P 500.
The Consumer Price Index (CPI) is one of the most widely recognized price measures for tracking the price of a market basket of goods and services purchased by individuals. The weights of components are based on consumer spending patterns. The Purchasing Manager’s Index is an indicator of the economic health of the manufacturing sector. The PMI index is based on five major indicators: new orders, inventory levels, production, supplier deliveries and the employment environment. Gross domestic product (GDP) is the monetary value of all the finished goods and services produced within a country’s borders in a specific time period, though GDP is usually calculated on an annual basis. It includes all private and public consumption, government outlays, investments and exports less imports that occur within a defined territory.
The Bloomberg Dollar Spot Index tracks the performance of a basket of 10 leading global currencies versus the U.S. Dollar.
The Producer Price Index (PPI) program measures the average change over time in the selling prices received by domestic producers for their output.
The Manheim Used Vehicle Value Index is a measurement of used vehicle prices that is independent of underlying shifts in the characteristics of vehicles being sold. The PHLX Semiconductor Sector Index is designed to measure the performance of the 30 largest U.S.-listed semiconductor companies.


