
The Ripple Effects of America’s New Credit Rating
The Ripple Effects of America’s New Credit Rating
Fitch Ratings sent shockwaves through the financial world last week when it unexpectedly downgraded the United States’ credit rating from AAA to AA+.
This represents only the second time in U.S. history that a ratings agency has taken this action, the first time being when Standard & Poor’s lowered its rating in response to the government’s handling of the 2011 debt-ceiling crisis.
The rationale for Fitch’s downgrade appears to be much the same. Among the reasons given are the U.S. government’s “repeated [debt] limit standoffs and last-minute resolutions.” The New York City-based agency also cited growing debt fueled by tax cuts and new spending, as well as the rising cost of entitlement programs such as Social Security and Medicare.
(For those keeping score, the combined cost of Social Security and Medicare in June was more than $2.3 trillion, or approximately 9% of U.S. GDP.)
Although the U.S. remains strong with its large, diversified economy and the U.S. dollar’s status as the primary global reserve currency (for now), challenges could lie ahead. Predictions of a mild recession toward the end of 2023 and early 2024, coupled with tightening credit conditions, suggest turbulence may lie ahead.
Repercussions of the Downgrade
The credit downgrade has already had an impact on Treasuries and stocks, complicating investor sentiment about Treasury debt. Yields pushed higher post-decision, with the 30-year yield exceeding 4.3% on Thursday for the first time since November. (Bond yields rise when prices fall, and vice versa.)
A credit rating downgrade can lead to a number of consequences, perhaps the most obvious being an increase in the country’s borrowing costs due to a perceived greater risk of default. As a result, the U.S. government may end up having to pay more interest on its new debt issues, further deepening its debt burden.
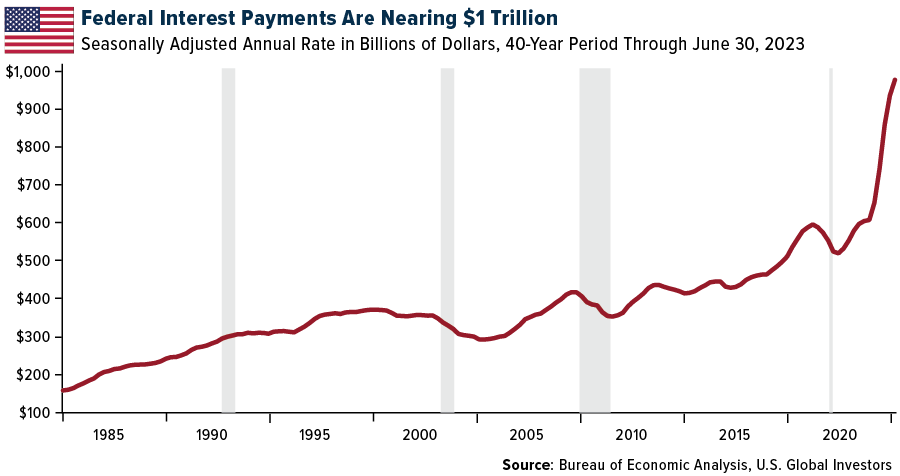
Having surpassed a record $25 trillion in outstanding Treasuries, the government pays nearly $1 trillion in interest, or roughly a third of what it collects in taxes. Meanwhile, the Treasury Department just announced it expects to issue over $1 trillion in new debt in the third quarter.

The downgrade could also lead to currency devaluation if foreign investors opt to sell off their holdings, thereby increasing the supply of the currency in foreign exchange markets.
We may also see short-term volatility in stock markets. When U.S. debt was downgraded in August 2011, the Cboe Volatility Index, or VIX, jumped to as high as 48.3, up significantly from 22.5 at the beginning of the month.
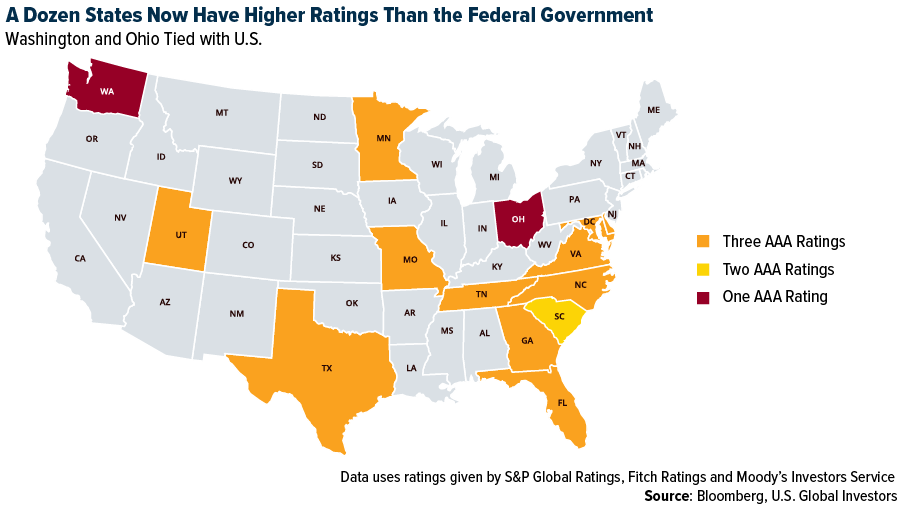
With the federal government downgraded, 12 U.S. states now boast higher credit ratings than the federal government, according to Bloomberg. They include robust, well-managed state economies such as Texas and Florida.

Changing Correlations and Investment Strategies?
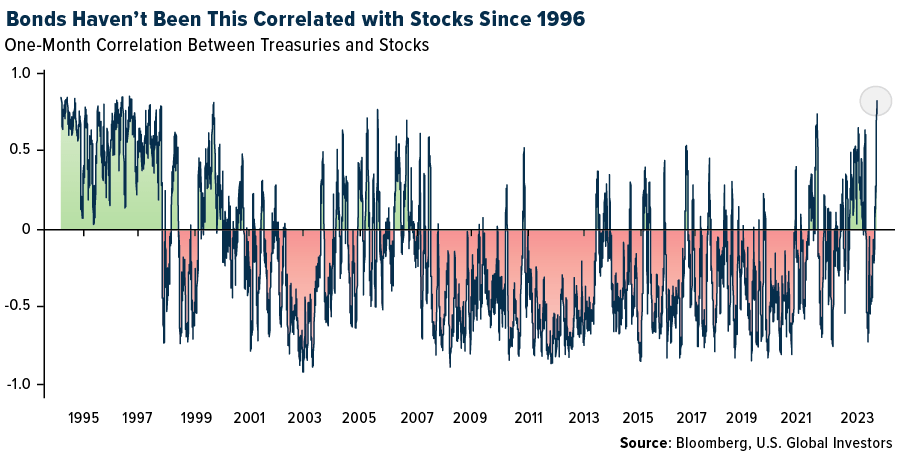
Treasuries have been prized for having a low to negative correlation with stocks, often making them an essential part of a traditional 60/40 portfolio. But in the past month, and especially since Fitch’s decision, government debt has become less effective as a stock hedge, a trend not seen since the 1990s. As you can see below, the correlation between the Bloomberg U.S. Treasury Total Return Index and the S&P 500 has strengthened to 0.82, the highest since 1996, indicating a weaker bonds hedge against equity risks. (A correlation of 1.0 would mean that the two assets consistently move in the same direction on a daily basis.)

These changes have left Treasuries on the verge of wiping out their gains for the year, frustrating those who may have expected a rally following the potential end of the Federal Reserve’s tightening cycle.
With yields heading higher, the equity-risk premium, a measure of the extra reward investors get for holding stocks over bonds, has also dropped to its lowest in two decades. According to the Wall Street Journal, the spread between the earnings yield of the S&P 500 and the 10-year Treasury yield has shrunk to approximately 1 percentage point, the narrowest reading since 2002.
Although low-risk premiums aren’t necessarily indicative of a market downturn, the consensus on Wall Street is that this cannot persist indefinitely. The closer we get to the end of the Fed’s tightening cycle, we should see a decline in bond yields, boosting the appeal of stocks and bond prices.
In the meantime, I believe gold and silver continue to look very attractive as portfolio diversifiers. Gold maintains a slightly negative correlation to the S&P 500, meaning it may move in the opposite direction of the market. As of today, silver has a negligible 0.06 correlation, suggesting it’s currently agnostic to the direction stocks are moving in.
Looking Ahead
Despite the concerns posed by the credit downgrade, there are always opportunities in the market. Investors should remain vigilant, keep an eye on developing trends and adjust their strategies accordingly. The present situation is a testament to the dynamic nature of financial markets, with changes in credit ratings, correlations and market indicators calling for responsive investment strategies.
This fluidity is the very essence of investing and is what makes the world of finance so intriguing. As always, the key is to stay informed, stay adaptive and stay invested.
All opinions expressed and data provided are subject to change without notice. Some of these opinions may not be appropriate to every investor. By clicking the link(s) above, you will be directed to a third-party website(s). U.S. Global Investors does not endorse all information supplied by this/these website(s) and is not responsible for its/their content.
A bond’s credit quality is determined by private independent rating agencies such as Standard & Poor’s, Moody’s and Fitch. Credit quality designations range from high (AAA to AA) to medium (A to BBB) to low (BB, B, CCC, CC to C).
The S&P 500 Stock Index is a widely recognized capitalization-weighted index of 500 common stock prices in U.S. companies. The VIX Index is a financial benchmark designed to be an up-to-the-minute market estimate of the expected volatility of the S&P 500 Index, and is calculated by using the midpoint of real-time S&P 500 Index option bid/ask quotes. The Bloomberg US Treasury Index measures US dollar-denominated, fixed-rate, nominal debt issued by the US Treasury. Treasury bills are excluded by the maturity constraint, but are part of a separate Short Treasury Index.


