


Investor Alert
The Quest for Zero Energy Loss and the Fusion Frontier
Date Posted: August 11, 2023
Read time: 39 min
Superconductivity, or the idea that certain materials are capable of conducting direct current (DC) electricity without resistance or energy loss, has been an elusive phenomenon for well over a century.
Superconductivity, or the idea that certain materials are capable of conducting direct current (DC) electricity without resistance or energy loss, has been an elusive phenomenon for well over a century.
In 1911, a Dutch scientist named Heike Kamerlingh-Onnes found that mercury could superconduct electricity at very low temperatures, a monumental discovery for which he was awarded the Nobel Prize.
In the decades since, many more alloys and substances have also been shown to have superconductivity properties, but none so far has been able to work in a stable, room-temperature setting—the Holy Grail of physics.
That’s why it was such a big deal last month when a team of South Korean scientists claimed to have created a breakthrough material, referred to as LK-99, that could supposedly conduct electricity without any resistance at room temperatures and ambient (or normal) pressure. If confirmed, such a discovery could revolutionize the energy sector, address climate change and significantly reduce energy waste and costs, not to mention contribute to advancements in MRI technology, magnetic levitation trains, fusion energy and more.
The Rise and Fall of LK-99
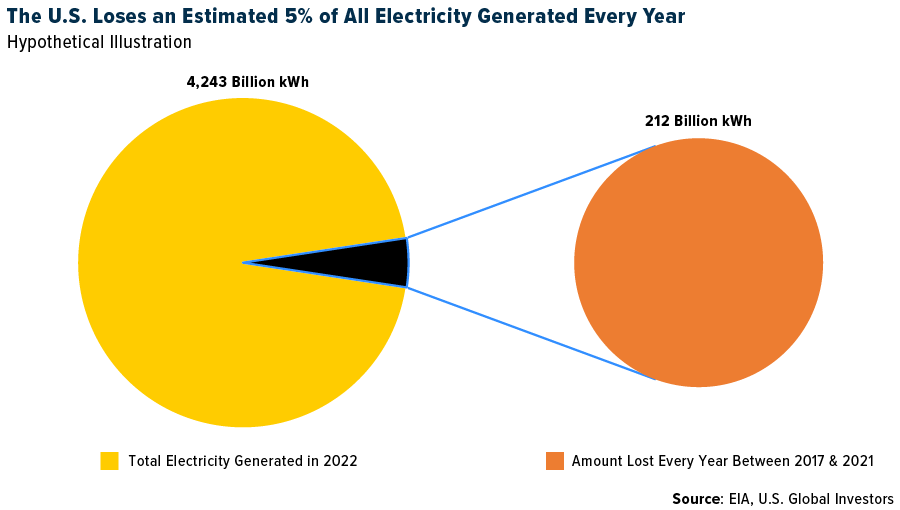
It’s impossible to overhype the significance of this allegation. Picture zero energy loss. The U.S. Energy Information Administration (EIA) has estimated that roughly 5% of electricity transmission and distribution is lost annually. That may not sound like a lot—until you learn that the U.S. generated over 4.2 trillion kilowatt hours (kWh) in 2022.
We’re talking billions and billions of dollars in recovered energy every year.
Following the startling announcement, shares of Korean and Chinese superconductor stocks soared, but as is often the case in any nascent technology that makes extraordinary promises (do Elizabeth Holmes and Theranos ring a bell?), LK-99’s validity came under fierce scrutiny. Many universities and labs around the world eagerly tried to replicate the experiment, to mixed results.
The final blow came early this week when the University of Maryland’s Condensed Matter Theory Center (CMTC) tweeted, disappointedly, that LK-99 appeared not to be a superconductor after all. The researchers, in fact, found that LK-99 was “a very resistive poor quality material.”
With a great deal of sadness, we now believe that the game is over. LK99 is NOT a superconductor, not even at room temperatures (or at very low temperatures). It is a very highly resistive poor quality material. Period. No point in fighting with the truth. Data have spoken.
— Condensed Matter Theory Center (@condensed_the) August 8, 2023
This led to a swift downturn in South Korean superconductor stocks. Wire technology companies Duksung Co. and Sunam Co. both closed the Tuesday session down approximately 30%.
Despite the letdown, I don’t believe this is the last we’ll hear of a potential breakthrough in superconductivity. LK-99 may have been a failure, but humans are far too innovative and competitive to let the matter rest.
Fusion Ignition Is Lighting Up the Energy Landscape
On a related note, there have been strides in fusion energy, which could offer a clean, limitless source of power. In December, I shared with you that the Lawrence Livermore National Laboratory (LLNL) in California successfully demonstrated the first-ever fusion “ignition,” meaning the experiment yielded more energy than it took in.
This week, the LLNL announced that it repeated the results, achieving a net energy gain from a fusion reaction and heralding a pivotal milestone toward the commercial realization of fusion power.
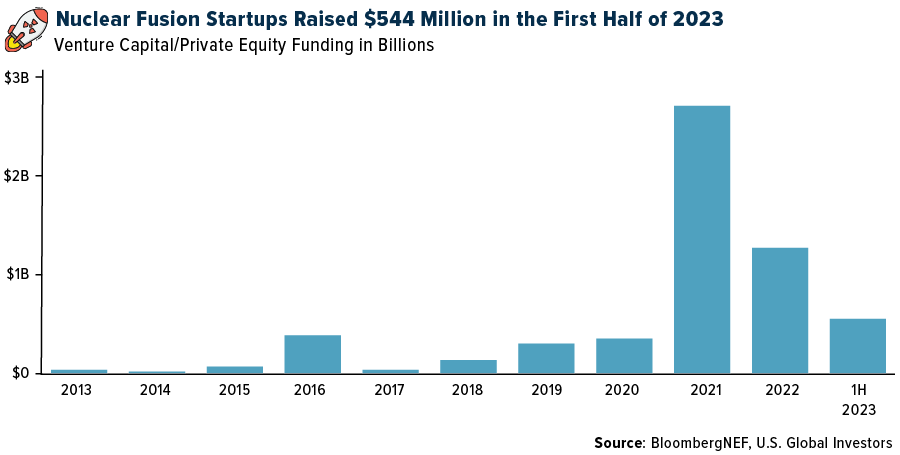
Given these breakthroughs, fusion-related investments have skyrocketed. In 2021 alone, investments surged to $2.6 billion from just $300 million in the prior year. Although 2022 saw a decrease to $521 million, 2023 is already showing promising traction, according to Bloomberg. In the first half of the year, nuclear fusion firms and startups secured $544 million in venture capital and private equity investments.
The world currently boasts 33 nuclear fusion startups, according to data provider Dealbook.co, all of them located in countries recognized for their contributions to international fusion research. Leading the pack, the U.S. is home to five of these startups, followed by the U.K. with four. Germany has two, while Japan, Canada, France and Australia each have one.
As a reminder, we’re still many years away from using and enjoying fusion energy on a commercial scale, but the news is exciting nonetheless, especially when paired with the promise of superconductivity.
Innovation Versus Practicality for Investors
Even with the anticipation swirling around fusion, we’re reminded of the costs and challenges involved in high-tech energy endeavors.
Late last month, a new nuclear reactor began operations in Georgia, the first such U.S. plant in decades.
Georgia Power Co., a subsidiary of Atlanta-based Southern Company, announced the completion of Unit 3 at Plant Vogtle, which is now sending power to the grid. When operating at its maximum capacity of 1,100 megawatts, the reactor is capable of powering over 500,000 homes and businesses across Georgia, Florida and Alabama.
However, Unit 3 reportedly came seven years behind schedule and a whopping $17 billion over budget. It’s a salient reminder for investors to tread carefully, weighing the promise of innovation against practical challenges.
I urge investors to keep a keen eye on developments in the superconductivity and fusion sectors. They represent not just the future of energy, but also a realm of unique investment opportunities. Remember, in every challenge lies opportunity.

Index Summary
- The major market indices finished mixed this week. The Dow Jones Industrial Average gained 0.62%. The S&P 500 Stock Index fell 0.31%, while the Nasdaq Composite fell 1.90%. The Russell 2000 small capitalization index lost 1.65% this week.
- The Hang Seng Composite lost 2.82% this week; while Taiwan was down 1.44% and the KOSPI fell 0.44%.
- The 10-year Treasury bond yield rose 12 basis points to 4.161%.
Airlines and Shipping
Strengths
- The best performing airline stock for the week was Turkish Air, up 6.8%. Chinese domestic travel is strong with domestic air ticket spending tracking 30% above pre-Covid levels during the July summer peak. Japan is seeing strong domestic leisure and inbound volumes with summer Obon holiday reservations returning to pre-Covid levels this year. Additionally, Indian air traffic has faced seasonal pressure since July and IndiGo has also warned of a sharper-than-usual drop in passenger yields in the coming months.
- Containership spot freight rates are starting to recover, with three major pricing indices, namely the Shanghai Containerized Freight Index (SCFI), Freightos Baltic Index (FBX) and Drewry World Container Index (WCI), registering week-over-week increases over the past 2/3/4 weeks, respectively. The latter two indices have a higher weight of freight forwarders, hence slightly leading. While sustainability of rate increases is yet to be watched out for, the rate rebound reflects some pick-up in activity during the traditional Transpacific peak season.
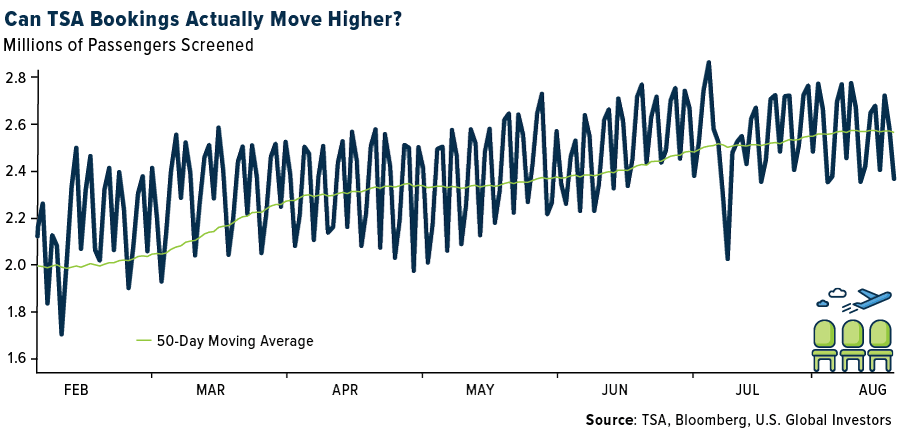
- Airlines and airport operators published reservation data for Japan’s upcoming “O-bon” holiday. Passenger numbers on domestic flights are essentially at 100% of 2019 levels and the data reconfirms continued strong reservation trends, similar to those from the JR rail reservations that were published recently.
Weaknesses
- The worst performing airline stock for the week was Copa, down 11.1%. After a very strong June, when airlines outperformed the market by roughly 18%, airline stocks declined 5% in July, and underperformed the S&P 500 by about 8%. For the year, airline stocks are now up 28%, compared to the S&P 500’s 19% rise, with the group outperforming in January, February, May, and June (while underperforming in March, April, and July). While all the focus has been on weak revenue outlooks from domestic airlines this earnings season, recent jet fuel moves also create EPS risk for the group.
- UPS cut its full-year 2023 outlook for the second consecutive quarter, saying it now expects U.S. domestic operating margin of roughly 10% (down from 11% last quarter and 12% in its “base case” at the start of the year), with international margins in the range of 19-20%
- The Department of Transportation (DOT) paused its review of Allegiant and Viva Aerobus’ Joint Venture. According to the AirInsightGroup, Carol A. Pesonk, Assistant Secretary for Aviation and International Affairs at the DOT, sent a letter to Mexico’s Transportation Undersecretary notifying him that the DOT is suspending the procedural schedule for the review of the Allegiant and Viva Aerobus application, effective immediately. Allegiant and Viva Aerobus first filed this application on December 1, 2021, and announced plans for a fully integrated Commercial Alliance Agreement. Through this alliance, ALGT would gain access to popular vacation destinations such as Cancun, Los Cabos and Puerto Vallarta, Mexico, while Viva Aerobus would gain access to ALGT’s distribution network and point-of-sale process.
Opportunities
- A huge backlog of travel demand formed among Chinese consumers during the three years of Covid controls. Beijing continues prioritizing domestic travel over international given multiple economic headwinds. We could witness meaningful recovery in outbound tourism likely around next Chinese New Year holiday in mid-February 2024.
- The impact of higher fuel costs should drive owners to slow their ships to improve fuel consumption. While some markets were already slow steaming ships, additional slow steaming could take place going forward helping to reduce the effective supply of ships and giving upward momentum to shipping rates.
- After meaningfully underperforming international bookings over the better part of this year, domestic bookings are beginning to show some recovery. On a trailing four-week basis, domestic sales have accelerated nearly 8% compared to international sales, up 4%. However, the rate of growth in the latest week still favors international with domestic sales up 5.3% and international up 13.9% year-over-year. Large corporate volume growth, which has continued to lag in the post-pandemic recovery, was positive for the third consecutive week after nearly three months of negative weekly year-over-year growth.
Threats
- According to an article published by Estadão, Brazil President Lula da Silva announced yesterday that he would meet with airlines to discuss the high cost of airline tickets. The Chief Executive stated that he requested a study on ticket prices and the number of flights from the Minister of Ports and Airports, Márcio França. Moreover, Mr. Lula added that he will also discuss the lack of regional flights and wants to understand what is happening in Brazilian aviation as, according to him, jet fuel has dropped by 32% and air ticket prices have not followed the same trend.
- Credit Suisse downgraded UPS on concerns that its new labor contract locks in onerous wage increases for the year ahead, which it believes were likely to pressure margins. These fears were confirmed by UPS on its earnings call, as management noted that the immediate step-up in wages was a priority for the union and would be a headwind to results through July 2024.
- Hawaiian (HA) lowered capacity every month through year-end by roughly 150 basis points each month. The moves could be related to the Pratt & Whitney recall of GTF engines which power HA’s A321neo fleet. That said, HA’s schedule has already been negatively impacted by A321neo availability this year given engine maintenance challenges. The airline mentioned on its recent earnings call that it had planned to have two planes out of service for the next few months, improving to one in the fourth quarter.

Luxury Goods and International Markets
Strengths
- Tapestry Inc. agreed to buy Capri Holdings Ltd. for $8.5 billion in a cash deal. Shares of Capri Holdings surged more than 55% on Thursday, closing at $53.90 per share. The acquisition is expected to be completed next year.
- China has become the first country where Ferrari sells more than a quarter of its new and used cars to women, as the company is witnessing a growing interest from wealthy female buyers in the product. Mainland China, Hong Kong, and Taiwan accounted for 12% of Ferrari’s sales last year with almost 1,600 cars, more than double the amount compared to five years ago, according to the company’s annual report.
- Capri Holdings Ltd. was the best performing S&P Global Luxury stock in the past five days, gaining 49.65%. Shares gained on Thursday after Tapestry made an offer to buy Capri Holdings at a 65% premium to the prior day’s closing price.
Weaknesses
- Ralph Lauren on Thursday forecast current-quarter sales largely below Wall Street expectations, reports Reuters, as demand for its pricey sweaters, shirts, and outdoor wear tapers amid a broad slowdown in U.S. luxury spending.
- China reported weaker economic data this week. The consumer price index (CPI) fell 0.3% in July, which was the first negative inflation reading since early 2021. In addition, the country’s imports and exports fell more sharply than expected last month, amid waning global demand for Chinese products.
- Faraday Future Intelligence was the worst performing S&P Global Luxury stock in the past five days, losing 17.96%. Shares declined more than 10% on Monday after the company announced a new round of financing to support the production of the long-awaited FF 91 car.
Opportunities
- Li Auto, a Chinese electric car producer, announced a quarterly earnings beat this week. The CEO, during the earnings call, said that the company has a plan to become the top-selling luxury brand in China, ousting German automakers like Mercedes-Benz and BMW. The company is planning to significantly increase production in the fourth quarter of this year, delivering 40,000 cars per month.
- China removed more post-Covid restrictions, adding almost 80 new destinations, including South Korea, Japan, and Australia, to a list of countries approved for group travel. Chinese tourists can now travel to almost 140 countries around the world, which should boost global luxury spending.
- Bloomberg economists expect retail sales in the United States to improve. The month-over-month sales are predicted to increase by 40 basis points. Data will be released on August 15.
Threats
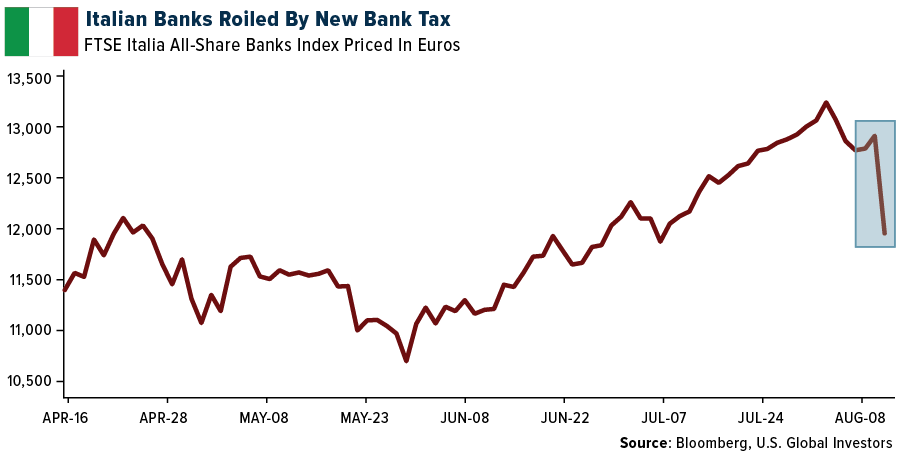
- On Monday, the Italian authorities unveiled a new measure: a 40% levy on banks’ additional earnings. This policy shift resulted in a substantial outflow of $10 billion from the banking sector the following day. This series of actions has the potential to trigger a ripple effect, prompting additional nations to consider similar measures. Consequently, financial markets may experience a further correction, causing an adverse impact on luxury expenditure.
- China, an important market for luxury goods consumption, reported weaker economic data this week. In addition, Chinese property developer, Country Garden, missed payments on two-dollar bond coupons worth $22.5 million combined. Moody’s downgraded the company’s corporate rating by three notches to ‘Caa1’ from ‘B1’ with a negative outlook, citing heightened liquidity and refinancing risk after the company missed bond payments.
- This week, Moody’s cut the ratings on 10 smaller banks and put six larger institutions on notice, including US Bancorp, Bank of New York Mellon, State Street and Truist Financial. It also changed its outlook to negative for 11 major lenders, including Capital One, Citizens Financial and Fifth Third Bank.

Energy and Natural Resources
Strengths
- The best-performing commodity for the week was natural gas, which rose 7.84% domestically. International prices surged due to a potential strike in Australia, which might cut 10% of global liquified natural gas (LNG) production. Bloomberg reports that global oil markets are poised for a significant supply deficit of over 2 million barrels a day this quarter. This is because Saudi Arabia reduced its oil production to bolster global oil prices. Consequently, consumers are witnessing the steepest production decline from OPEC in the last two years. West Texas Intermediate (WTI) has now increased for seven consecutive weeks due to tighter supplies.
- Uranium prices have maintained their gains. Sellers kept their offers stable, even though buying interest is limited, and the markets are in their quieter season. Euratom, the European Union’s (EU) nuclear agency, mentioned there’s no immediate risk to European nuclear supply from the coup in Niger, which was responsible for 25% of 2022 imports. This is attributed to the three-year uranium fuel reserves. In other news, Uniper, a German state-owned energy company, stated that it doesn’t intend to invest further in nuclear reactors in Sweden. Instead, it will shift its focus to renewable energy investments.
- U.S. oil production this year is projected to increase more quickly than anticipated. This will supply more crude to a market already tightened by Saudi Arabian output reductions. Higher-than-expected well productivity, combined with rising crude prices, is set to propel U.S. production to a record 12.8 million barrels a day in 2023. This is up from an earlier forecast of 12.6 million, according to a monthly report from the U.S. Energy Information Administration (EIA), released on Tuesday. The U.S. averaged around 11.9 million barrels a day in 2022.
Weaknesses
- The worst-performing commodity for the week was nickel, which declined by 4.31%. This drop was prompted by Indonesia’s potential move to amplify its battery-grade nickel production fourfold. They’ve developed a new process that upgrades lower-grade ores. Iron ore prices dipped by 5% this week to $100/ton, which is 12% beneath the July peak. Investors are mulling over the implications of China’s recent activity data and policy indications. China’s July PMI data seems to indicate somewhat divergent industrial recovery trajectories. JPM China Economists theorize that industrial activity (linked to domestic industrial demand) probably continued its upward trend into July, following the positive trend in June.
- The leading listed copper producers are expected to account for 55% of the estimated copper mine production in 2023 (12.3mtpa). After a weak first quarter, the second quarter saw a 6% quarterly increase in aggregate mine production. However, it’s still down 2% year-over-year. For the first half of 2023, mine production was down 2% year-over-year, marking the lowest since the first half of 2017. With the production results of the second quarter of 2023 in, prominent listed copper miners have reduced their full-year 2023 copper production guidance by 280,000 tons.
- Iron ore plummeted to its lowest since early June after Goldman Sachs alerted about the potential of China reducing steel output in this half. This comes at a time when traders are dealing with off-peak seasonal demand. Futures in Singapore decreased by as much as 2.5%, falling below $100 a ton, marking the lowest intraday level since June 1. This decline on Monday comes after a series of six weekly losses in the previous seven weeks for this crucial steel-making component.
Opportunities
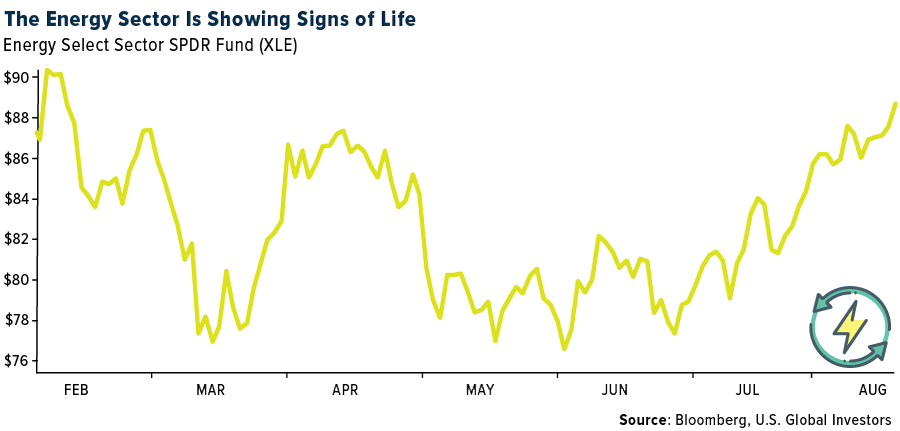
- Goldman Sachs maintains a positive outlook on the energy sector, despite the current macroeconomic volatility, for several reasons:
- Cash Return to Shareholders: They anticipate that the EU Big Oils group will provide an average total cash return of 12% to shareholders in 2023.Stable Free Cash Flow (FCF) and Continued Capital
- Discipline: They project the sector to achieve a 13% FCF yield in 2023.
- Positive Earnings Revisions: They believe that the era of negative earnings revisions for the sector has concluded.
- Goldman argues that the earnings hit their lowest point in 2Q23 and predict a rebound in 3Q and the second half of the year. This recovery will likely be driven by increasing oil prices and refining margins.
- U.S. gasoline stocks are currently at 219,000 barrels, marking the lowest for this time of year since 2015. This is 5 million barrels, or 5%, below the preceding 10-year seasonal average, as per EIA data. Moreover, the U.S. distillate oil inventory stands at about 117 million barrels, which is roughly 14% lower than the five-year average of 137 million barrels. U.S. crude oil stocks witnessed a record drop last week, decreasing to 439,000 barrels as exports exceeded 5 million barrels per day and refineries processed a higher volume of crude.
- A significant factor supporting a bullish perspective on copper pertains to the metal’s dwindling mine supply. With most Q2 results now available, the global mine supply for the first half of the year indicates a modest 2% year-over-year growth. This growth rate is slightly below the annual disruption-adjusted mine supply growth projection of 2.3% for the year. Although the shortfall in mine supply for the year to date versus the annual forecast is minimal, it’s crucial to note that in mid-2022, the projected growth for 2023’s global mine supply was nearly 5% year-over-year.
Threats
- Niger accounts for approximately 5% of global uranium mining output. More significantly, its supply constitutes 24% of the EU’s uranium imports, making it a marginally larger supplier than Kazakhstan to the EU. With a strategic shift in the West away from Russian fuel supply, utilities have had to re-evaluate their entire supply chain. This recent challenge probably amplifies the urgency for utilities to ensure a stable supply for the future. Although Orano mentioned that the export ban hasn’t been formally enforced yet, it could mean that Niger’s supply might be redirected to China. As a result, those who previously sourced from Niger might have to turn to North America and Australia. The EU’s nuclear agency, Euratom, has confirmed that it possesses the equivalent of three years’ worth of nuclear fuel supply in various stages.
- The lithium market continues to experience exponential growth. Rapid expansion results in the market’s balance quickly alternating between surpluses and deficits. This instability in fundamentals is evident in price trends. Prices for spodumene (mine supply) and for carbonate and hydroxide (downstream chemicals) have seen a significant decline. However, the prices of chemicals remain somewhat stable, supported by the still-high quotations for spodumene.
- The substantial 27% surge in LNG prices to almost 40 euros per megawatt hour is a reaction to reports suggesting that potential strikes could disrupt Australia’s North West Shelf LNG export facility. This is in addition to the strike threats at the Wheatstone and Gorgon facilities mentioned earlier. Combined, these facilities account for about 10% of the world’s LNG supply.
Bitcoin and Digital Assets
Strengths
- Of the cryptocurrencies tracked by CoinMarketCap, the best performer for the week was Shiba Inu, rising 18.78%.
- Michael Novogratz said he sees signs of increased participation in cryptocurrency markets by more traditional institutional investors in the wake of the turmoil in the digital-asset world last year, writes Bloomberg.
- Bitstamp, one of the oldest crypto exchanges, is in talks to raise fresh funding. They started the fundraising process in late June with Galaxy Digital as an adviser. The exchange plans to use the funds for operations including launching derivatives trading in Europe next year, writes Bloomberg.
Weaknesses
- Of the cryptocurrencies tracked by CoinMarketCap, the worst performer for the week was XDC Network, down 11.03%.
- About 13% of crypto hedge funds have shut down so far this year, as weak performance and difficulties in accessing banking services weighed on the industry, according to data tracked by Switzerland-based investment adviser 21e6 Capital AG.
- Block Inc. tumbled as much as 14% after reporting results fell short of some analysts’ expectations. Shares fell 11% to $65.14 after dropping to as low as $63.38, the biggest intraday plunge since March, writes Bloomberg.
Opportunities
- PayPal Holdings is rolling out a stablecoin, the first by a large financial company and a potentially significant boost to the sluggish adoption of digital tokens for payments, according to Bloomberg.
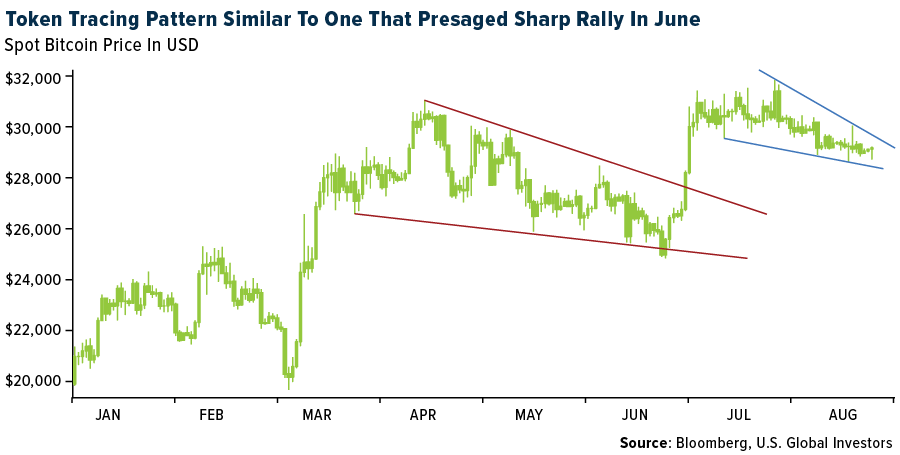
- Bitcoin may be close to bursting out of a period of unusually low volatility if chart patterns and the token’s history are any guide. Bitcoin has traced a falling wedge that resembles a pattern that presaged a June rally, according to an article published by Bloomberg.
- Marathon Digital Holdings’ second-quarter loss narrowed, and revenue jumped, as the Bitcoin miner increased sales of the cryptocurrency in the aftermath of a rebound in prices, writes Bloomberg.
Threats
- Tension between traders and creators of digital collectibles is deepening amid a painful slump in the market for NFTs. The friction stems from moves by top NFT exchanges Blur and OpenSea to slash royalty rates payable to artists when a token’s ownership changes, writes Bloomberg.
- Crypto entrepreneur Justin Sun transferred more than $200 million of digital tokens to his exchange Huboi Global this year to prop up reserves. Falling reserves can be an indication that traders are withdrawing funds on concerns about a platform’s viability, writes Bloomberg.
- Ethereum recorded its worst week of the year in terms of illicit flows. Data tracked by Chainalysis shows that known illicit flows as a percentage of total flows on Ethereum reached 2% for a period of several days just last week, writes TheBlock.co.

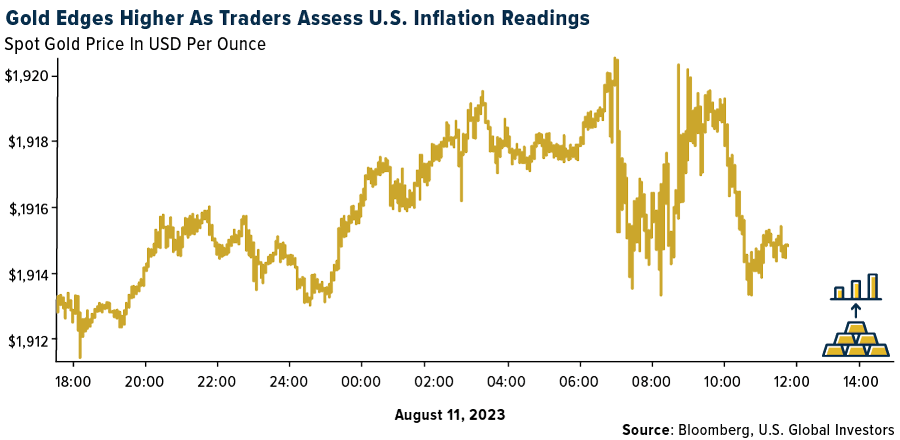
Gold Market
This week gold futures closed the week at $1945.70, down $30.40 per ounce, or 1.54%. Gold stocks, as measured by the NYSE Arca Gold Miners Index, ended the week lower by 0.54%. The S&P/TSX Venture Index came in off 1.39%. The U.S. Trade-Weighted Dollar rose 1.50%.
Strengths
- The best performing precious metal for the week was palladium, up 2.72%, on what might be the beginning of a short squeeze. Palladium had fallen 24% since mid-May, up until a recent rally on news that speculators had taken their short palladium positions to the most bearish position on record going back to December 2009. China raised its gold reserves for a ninth straight month in July as central bank purchases continue to underpin prices of the precious metal. Bullion held by the People’s Bank of China (PBOC) rose by 740,000 troy ounces, the central bank said on Monday, which is equivalent to about 23 tons.
- For Alamos Gold, based on 44% higher reserves versus the 2017 study, total production is now expected to be 2.2 million ounces, up 46% versus 1.5 million ounces in the 2017 study. LOM AISC is now expected to be $814 per ounce, up 9% from $745 per ounce in the 2017 study.
- Franco-Nevada reported second quarter adjusted earnings of $0.95 per share, ahead of consensus of $0.89 per share. When compared to consensus, results were ahead in the precious metals segment. In the quarter, operations at Cobre Panama and Antapaccay successfully returned to full production, contributing strong deliveries to Franco-Nevada. Overall, for the quarter, Franco-Nevada reported gold-equivalent ounces (GEOs) of 168,515 ounces, ahead of consensus of 166,000 ounces.
Weaknesses
- The worst performing precious metal for the week was silver, down 4.14%, illustrating it’s near 3 to 1 leverage factor to the price move in gold this week. Gold had choppy daily price action with a bias to the downside until a slight gain on Friday. Impala Platinum’s fiscal year 2023 gross refined production 6E declined 5% year-over-year to 2.92 million ounces and was ~2% below company-compiled consensus. The key miss was driven by IRS where volumes declined 16% year-over-year and came in 4% below consensus. Management highlighted 111,000 ounces of production was deferred due to power constraints, the delay to restart the refurbished Number 4 furnace, and cable theft at Impala Rustenburg.
- MAG Silver reported second quarter financial results with diluted EPS of $0.19 from attributable production of 2.32 million ounces silver that was pre-reported. Unit production costs were not reported, but aggregate production costs were $71.2 million (15% above consensus).
- Gatos reported second quarter 2023 EPS of -$0.05 compared to consensus of $0.05, resulting from both lower equity income pickup from the Los Gatos JV (driven by higher depreciation, depletion, amortization, and income tax expenses) and higher G&A costs at the corporate level (driven by an increase in one-time audit and consulting fees from the restatement of the financial statements).
Opportunities
- According to Scotia, Kinross’s focus for the next 12 months is on further de-risking key assets, which include some of the following: 1) delivering on the Tasiast 24,000 mill expansion to its sustained capacity by year-end, 2) delivering a PEA at Great Bear in 2024, including permitting the exploration decline, 3) de-risking the mine plan at Round Mountain, with construction of the decline in 2024 and study work at Gold Hill satellite.
- Greatland Gold would likely bid for full control of the Havieron gold-copper project in Western Australia if it goes up for sale following Newmont’s acquisition of
Newcrest, according to Managing Director Shaun Day. The Havieron and nearby Telfer gold mines and mill are likely to be among assets that Newmont will look to sell. - Silvercorp announced the planned acquisition of OreCorp Ltd. and its Nyanzaga Gold Project in Tanzania for A$242 million in cash and shares. This is the second acquisition announced by Silvercorp this year; in May, the company signed a non-binding term sheet to acquire Celsius Resources and its Maalinao-Caigutan-Biyog Project in the Philippines for A$56 million.
Threats
- Reuters reported that Mali has adopted a new mining code following prior reports that proposed changes were in the works to increase state ownership in new projects from 20% to 35%, although changes to the mining code have not been confirmed by Reuters or B2Gold. B2Gold recently noted on its second quarter conference call that its Fekola mine in Mali is governed by the 2012 mining code, so would not be susceptible to changes under any future mining code.
- For B2Gold, at the Fekola Complex, the permit for Bantako North permanent area was delayed pending the finalization of Mali’s new mining code. While details over the new code remain sparse, the main change seems to be related to an increase in government participation, from the current 20% to as much as 35%, as well as updates to taxes. BTG noted that it and other mining companies in the country have been engaging in discussions with the government to ensure an equitable environment for all stakeholders and a fair tax regime.
- Barrick Gold Corp. will not be pressured into making any major acquisitions even as its rivals pursue a flurry of dealmaking in the mining industry, Chief Executive Officer Mark Bristow said. “The market is constantly dragging us into the M&A
conversation, and we don’t need that,” Bristow said Tuesday in an interview at Bloomberg’s Toronto office. “We are not anti-M&A — it is a component of any industry rearrangement — but the problem is that, in the gold industry, most of the tier one assets remaining are embedded in bad assets. And you cannot
unlock them.”


U.S. Global Investors, Inc. is an investment adviser registered with the Securities and Exchange Commission (“SEC”). This does not mean that we are sponsored, recommended, or approved by the SEC, or that our abilities or qualifications in any respect have been passed upon by the SEC or any officer of the SEC.
This commentary should not be considered a solicitation or offering of any investment product. Certain materials in this commentary may contain dated information. The information provided was current at the time of publication. Some links above may be directed to third-party websites. U.S. Global Investors does not endorse all information supplied by these websites and is not responsible for their content. All opinions expressed and data provided are subject to change without notice. Some of these opinions may not be appropriate to every investor.
Holdings may change daily. Holdings are reported as of the most recent quarter-end. The following securities mentioned in the article were held by one or more accounts managed by U.S. Global Investors as of (06/30/2023):
United Parcel Service
Allegiant Travel
Nio Incorporated
Alamos Gold
Franco-Nevada
Impala Platinum
Kinross Gold
Silvercorp
B2Gold Corp
*The above-mentioned indices are not total returns. These returns reflect simple appreciation only and do not reflect dividend reinvestment.
The Dow Jones Industrial Average is a price-weighted average of 30 blue chip stocks that are generally leaders in their industry. The S&P 500 Stock Index is a widely recognized capitalization-weighted index of 500 common stock prices in U.S. companies. The Nasdaq Composite Index is a capitalization-weighted index of all Nasdaq National Market and SmallCap stocks. The Russell 2000 Index® is a U.S. equity index measuring the performance of the 2,000 smallest companies in the Russell 3000®, a widely recognized small-cap index.
The Hang Seng Composite Index is a market capitalization-weighted index that comprises the top 200 companies listed on Stock Exchange of Hong Kong, based on average market cap for the 12 months. The Taiwan Stock Exchange Index is a capitalization-weighted index of all listed common shares traded on the Taiwan Stock Exchange. The Korea Stock Price Index is a capitalization-weighted index of all common shares and preferred shares on the Korean Stock Exchanges.
The Philadelphia Stock Exchange Gold and Silver Index (XAU) is a capitalization-weighted index that includes the leading companies involved in the mining of gold and silver. The U.S. Trade Weighted Dollar Index provides a general indication of the international value of the U.S. dollar. The S&P/TSX Canadian Gold Capped Sector Index is a modified capitalization-weighted index, whose equity weights are capped 25 percent and index constituents are derived from a subset stock pool of S&P/TSX Composite Index stocks. The NYSE Arca Gold Miners Index is a modified market capitalization weighted index comprised of publicly traded companies involved primarily in the mining for gold and silver. The S&P/TSX Venture Composite Index is a broad market indicator for the Canadian venture capital market. The index is market capitalization weighted and, at its inception, included 531 companies. A quarterly revision process is used to remove companies that comprise less than 0.05% of the weight of the index, and add companies whose weight, when included, will be greater than 0.05% of the index.
The S&P 500 Energy Index is a capitalization-weighted index that tracks the companies in the energy sector as a subset of the S&P 500. The S&P 500 Materials Index is a capitalization-weighted index that tracks the companies in the material sector as a subset of the S&P 500. The S&P 500 Financials Index is a capitalization-weighted index. The index was developed with a base level of 10 for the 1941-43 base period. The S&P 500 Industrials Index is a Materials Index is a capitalization-weighted index that tracks the companies in the industrial sector as a subset of the S&P 500. The S&P 500 Consumer Discretionary Index is a capitalization-weighted index that tracks the companies in the consumer discretionary sector as a subset of the S&P 500. The S&P 500 Information Technology Index is a capitalization-weighted index that tracks the companies in the information technology sector as a subset of the S&P 500. The S&P 500 Consumer Staples Index is a Materials Index is a capitalization-weighted index that tracks the companies in the consumer staples sector as a subset of the S&P 500. The S&P 500 Utilities Index is a capitalization-weighted index that tracks the companies in the utilities sector as a subset of the S&P 500. The S&P 500 Healthcare Index is a capitalization-weighted index that tracks the companies in the healthcare sector as a subset of the S&P 500. The S&P 500 Telecom Index is a Materials Index is a capitalization-weighted index that tracks the companies in the telecom sector as a subset of the S&P 500.
The Consumer Price Index (CPI) is one of the most widely recognized price measures for tracking the price of a market basket of goods and services purchased by individuals. The weights of components are based on consumer spending patterns. The Purchasing Manager’s Index is an indicator of the economic health of the manufacturing sector. The PMI index is based on five major indicators: new orders, inventory levels, production, supplier deliveries and the employment environment. Gross domestic product (GDP) is the monetary value of all the finished goods and services produced within a country’s borders in a specific time period, though GDP is usually calculated on an annual basis. It includes all private and public consumption, government outlays, investments and exports less imports that occur within a defined territory.
The S&P Global Luxury Index is comprised of 80 of the largest publicly traded companies engaged in the production or distribution of luxury goods or the provision of luxury services that meet specific investibility requirements.
The Drewry World Container Index (WCI) measures the bi-weekly ocean freight rate movements of 40-foot containers in seven major maritime lanes.
The Freightos Baltic Index is a daily freight container index issued by the Baltic Exchange and Freightos. The index measures global container freight rates by calculating spot rates for 40-foot containers on 12 global tradelanes.
