
The “Putin Price Hike” Is Fake News
There’s more to the inflation story than the war in Ukraine.
By now you’ve heard that the annual rate of inflation hit a 41-year high of 8.5% in March. Prices for food, energy and used vehicles increased the most, with preowned cars and trucks jumped 35%, gasoline 48%.
But here’s something you may not know: The Bureau of Labor Statistics (BLS), which issues the monthly consumer price index (CPI), has changed its methodology for measuring inflation more than twice over the past few decades. Today’s CPI doesn’t actually tell us how much prices have changed; instead, it allegedly tells us changes in the cost of living.
This is why, in 2020, I called the CPI “fake news.” In reality, inflation as you and I understand it is running much higher than reported.
If we use the BLS’s methodology from 1980, prices actually increased 16.8% last month, which is almost double the official CPI print. The data below is courtesy of economist John Williams’ Shadow Government Statistics. 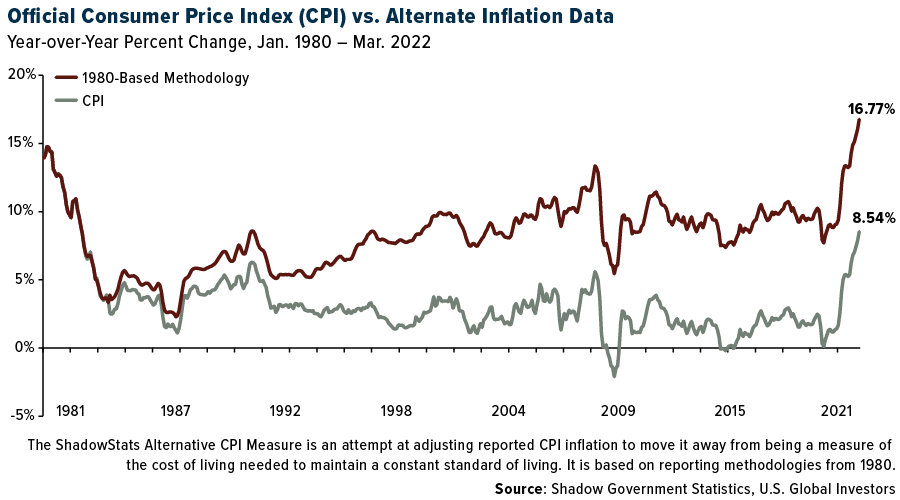
The Biden Administration blames the “Putin price hike” for elevated prices, particularly energy prices. This is simply more fake news.
Don’t get me wrong. The war in Ukraine has contributed to inflation in the short term. But there’s much more to the story, which began way before Russia invaded its neighbor.
From $100 to $58 in Only 20 Years
Since the start of the pandemic, rampant money-printing by central banks, including the Federal Reserve, has flooded the economy with cheap liquidity. It’s difficult to say exactly what percentage of U.S. dollars in circulation was “printed” in the past two years, but suffice to say, it’s huge. We can go back even earlier, to the first round of quantitative easing (QE) in 2008, when the Fed lowered rates to near zero and began buying $600 billion in mortgage-based securities (MBS).
This, combined with the ongoing knock-on effects of pandemic-related closures and lockdowns, has inflated prices to the extraordinary levels we’re witnessing today.
Here’s another way to look at it. Imagine it’s 2000, and let’s say a shopping cart of groceries costs you $100. Today, the same number of greenbacks would get you only $58 of the items in that basket of goods from 2000. That’s 42% fewer groceries on average for the same price. If you look at the chart closely, the deterioration of the U.S. dollar has only accelerated in the months since the pandemic. 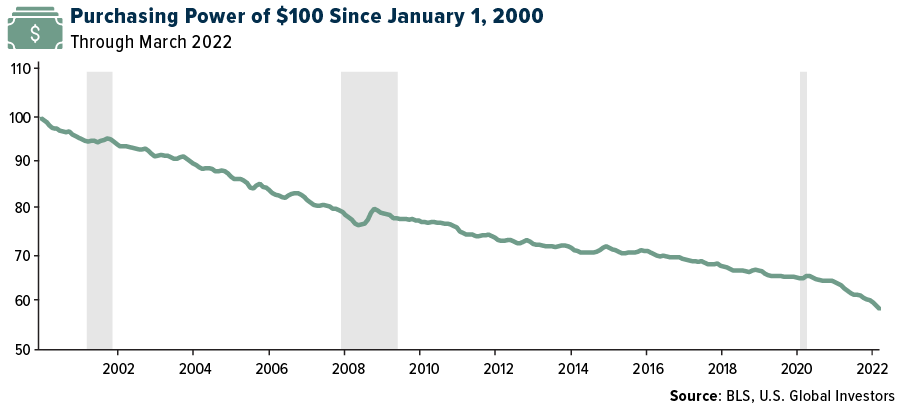
Putin may have won his first term as president of Russia in 2000, but I assure you he’s had nothing to do with any of this.
We’re Not Looking at Stagflation Just Yet
The good news is that economic conditions are not nearly as bad as they’ve been in prior periods of high inflation. Many comparisons have been made between now and the 1970s, with some calling Biden another Jimmy Carter.
The problem with that comparison is that Carter was dealing with not just sky-high inflation but also surging unemployment, a toxic mixture that often results in stagflation. What’s more, when Carter left office in January 1981, the headline interest rate was above 19%, which kneecapped economic growth.
Fortunately, unemployment today is at historically low levels, so we’re not looking at stagflation just yet.
Below is the Misery Index, a stagflation proxy that combines the unemployment rate and inflation rate. As you can see, the U.S. is still well below the 1970s, but the line is clearly going in the wrong direction.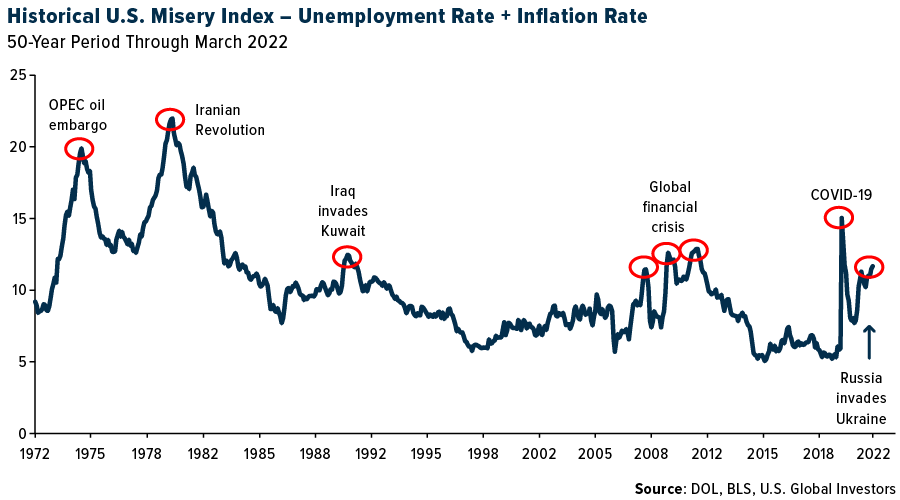
Stagflation has historically been triggered by a supply shock—note the timing of the OPEC oil embargo of the early 1970s and the 1979 revolution in Iran, a major oil producer. As of right now, Russia has not embargoed exports, but that’s a huge risk. The country is not only a major oil exporter, but it’s also a leading producer of palladium and platinum, natural gas, potash, nickel, aluminum and gold.
And then there’s Jerome Powell, whom I don’t envy. As I already pointed out, the unemployment rate is very low, but that could change overnight if the Fed raises rates too much too fast. The risk I see here is that, to keep the economy going at current levels, we must take a page out of Japan’s playbook and perpetually rely on highly accommodative monetary policy, and anything less than that will trigger a recession.
Did Someone “Orange-Pill” Janet Yellen?
So what’s the solution? As I heard many times at last week’s Bitcoin 2022 conference in Miami, “Bitcoin fixes this.” It’s the “escape hatch” from the current monetary system. As a completely decentralized, open-source asset, it has no board of directors, no governor or CEO.
Also at the conference, I heard many people talk about being “orange-pilled,” or “orange-pilling” their friends and family. This is a direct reference to the Matrix film series: Neo, played by Keanu Reeves, takes the red pill to “wake up” from the artificiality of the world around him and see it for what it truly is—a lie.
Similarly, people who “take the orange pill” recognize that the centralized, closed-source monetary system is stacked against them, and that Bitcoin is the solution. 
My question is who slipped the orange pill to Janet Yellen? The former Fed chair and current Treasury secretary has never stood out to me as a Bitcoin fan—in 2018, she called it “anything but useful”—but in a speech earlier this month, Yellen seemed to make an about-face.
She highlighted Bitcoin’s ability to reduce “reliance on centralized intermediaries like banks and credit card companies” and made reference to its “novel method for validating transactions using cryptography.”
During their panel at the Bitcoin 2022 conference, ARK Invest chief Cathie Wood and MicroStrategy founder Michael Saylor praised Yellen’s acknowledgement of Bitcoin’s appeal and benefits. Michael, in fact, went so far as to call the speech a “green light” for Bitcoin. He repeated the line again this week at the Exchange ETF conference.
Granted, Yellen likely has her eyes set on creating a U.S. central bank digital currency (CBDC), but I believe Bitcoin will be allowed to compete in the race.
If you haven’t seen my video on why I think CPI is fake news, you can do so by clicking here!
Index Summary
- The major market indices finished down this week. The Dow Jones Industrial Average lost 0.38%. The S&P 500 Stock Index fell 2.39%, while the Nasdaq Composite fell 3.93%. The Russell 2000 small capitalization index lost 0.24% this week.
- The Hang Seng Composite lost 0.80% this week; while Taiwan was down 5.34% and the KOSPI fell 8.76%.
- The 10-year Treasury bond yield rose 16 basis points to 2.829%.
Airline Sector
Strengths
- The best performing airline stock for the week was El Al, up 18.1%. European airline bookings continued to improve in the week, with an increase in international net sales. International net sales were up by three points to -31% versus 2019 (and versus -34% in the prior week), with 5% growth this week.
- System net sales improved slightly to -15.7% versus 2019 for the week compared to -17.2% last week. The international channel saw improvements across the board with pricing only -3.3% versus 2019, the best level during the pandemic.
- EasyJet has confirmed it expects to report a loss of GBP 535-565 million for 1H22, ahead of company-compiled consensus expectations of a GBP618 million loss and compared to a GBP701 million loss for 1H21. EasyJet continues to plan to operate 4Q22 capacity near 2019 levels, now ramping from 90% in Q3.
Weaknesses
- The worst performing airline stock for the week was Grupo Aeromexico, down 4.9%. Florida storms caused problems last weekend, although some airlines are experiencing continued difficulty, notably Spirit, JetBlue, and Allegiant where cancellations are at 22%, 14%, and 8%, respectively, versus 3% for other airlines.
- Leisure channel bookings through online ticket agencies, stepped back to -10.7% versus 2019 (versus -8.6% last week), but pricing held at up 9% versus 2019. After decelerating the prior two weeks, bookings through small travel agencies improved to -4.7% versus 2019 (from -7.6% last week).
- Second quarter planned growth for U.S. carriers is 30 basis points lower to -7% versus 2019 (-4% domestic, -15% international) versus down 10% versus 2019 in the first quarter. U.S. to Pacific region capacity is 110 basis points lower to -60% in second quarter 2022 versus second quarter 2019. Within the Pacific, U.S. to China capacity remains at -97% in the second quarter.
Opportunities
- Ryanair’s CEO commented that he expects average summer fares to be up 5-10% above 2019 levels, driven by lower market capacity and increased demand. The airline is seeing very strong forward bookings with pent-up demand over Easter weekend and summer holiday. Ryanair narrowed its fiscal year 2022 net loss guidance to EUR350-400 million from EUR250-450 million last week, with better-than-expected March net debt of EUR1.5 billion, due to a stronger booking inflow.
- U.S. airlines’ trailing seven-day website visits stepped up this week by 17% versus 2019 for the week (versus up 10% last week). This week, JetBlue’s trailing seven-day website visits improved the most given certain sales and the announcement of its Boston to London flights this summer (website visits up 26% versus 2019 compared to up 7% last week). Other carriers that had improvements this week were Southwest, Alaska Air, and Allegiant.
- JPMorgan says the latest Chase card spend data, which serves as a reliable leading indicator for the airline industry, remains resilient. Daily indexed spend has consistently remained above 2019 levels since March 2 and is currently accelerating yet again. With an estimated 45% of corporate demand still grounded and Asia still meaningfully neutered, they are confident current trends can continue.
Threats
- According to Raymond James, JetBlue’s call on the proposed offer with Spirit Airlines provided additional detail around strategic rationale, an asset play that pulls forward the Florida build-out. The deal allows JetBlue to grow its gates and add planes in the Florida market. There is execution risk due to high overlap of markets, and since this is a cash deal, debt will be elevated after the transaction.
- Crude prices are off the peak, but jet fuel costs remain stubbornly high given crack spreads that are at multi-year highs. Gulf coast/west coast jet fuel is in the $3.52 per gallon range while New York jet fuel is double the price given a localized supply problem. This could hurt those companies with big northeast exposure like JetBlue (22% of system flights leave from New York; New York jet exposure is 15%).

- According to JPMorgan, investors should expect broad-based capacity cuts. Industry supply is tight, and the group expects incremental capacity cuts to be announced imminently. Fuel prices remain elevated, OEM production woes are well-chronicled, the pilot shortage has grown even more acute, and balance sheets afford more incentive for restraint than in the past.
Emerging Markets
Strengths
- The best performing country in emerging Europe for the week was Turkey, gaining 3.65%. The best performing country in Asia this week was Pakistan, gaining 4.60%.
- The Turkish lira was the best performing currency in emerging Europe this week, gaining 0.84%. The Pakistani rupee was the best performing currency in Asia this week, gaining 1.75%.
- New bank lending in China rose more than expected in March. Chinese banks extended 3.13 trillion yuan ($492 billion) in new yuan loans in March, up sharply from February. Broad M2 money supply grew 9.7% in March from a year earlier, central bank data showed, above estimates of 9.2% forecasted by Bloomberg economists.
Weaknesses
- The worst performing country in emerging Europe for the week was Russia, losing 6.53%. The worst performing country in Asia this week was India, losing 1.86%.
- The Russian ruble was the worst performing currency in emerging Europe this week, losing 2.82%. The Philippine peso was the worst performing currency in Asia this week, losing 1.24%.
- China exports rose 14.7% year-over-year in U.S. dollar terms in March, better than consensus forecast of 13.0%. However, imports unexpectedly fell 0.1% against expectations of 8.0% growth, and followed 15.5% growth in prior months. Trade with Russia expanded 12% year-over-year in March, slower than February’s 25.7% growth, though trade ties were described as “normal course of business.”
Opportunities
- According to Hurun Global Rich List, an annual ranking complied by the private Shanghai-based company, the greatest number of billionaires (144) live in Beijing, followed by Shanghai at 121. The city of Shenzhen added eight billionaires in a year and overtook New York in rankings, which had 110 last year. China may continue to focus developing the Greater Bay Area that aims to link Shenzhen with eight other cities in the Guangdong province along with the Chinese territories of Hong Kong and Macau.
- China approved 45 domestic games, ending an eight-month game approval suspension since August 2021. The number of games approved is less than the monthly approved rate prior to the suspensions, and no Tencent, NetEase or Bilibili games were approved. However, this should be seen as a positive sign of normalization for the gaming regulatory environment, CLSA said.
- There is growing anticipation that China may provide another rate cut to support economic growth. This week China’s cabinet said the central bank would cut the amount of money that banks have to keep in reserve at the proper time. The People’s Bank of China (PBOC) usually announces a reduction within days of the State Council making such a statement.
Threats
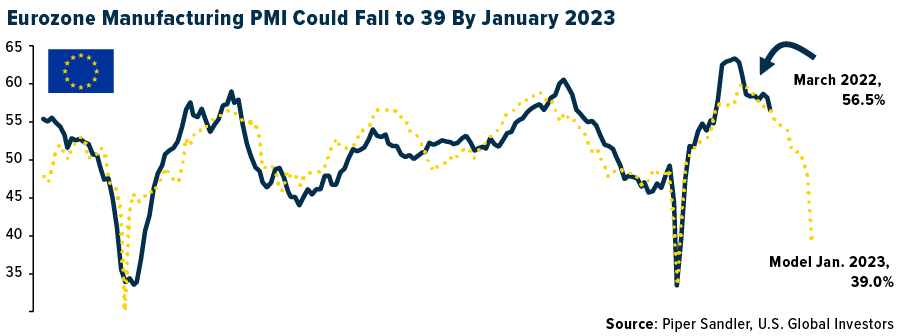
- According to Piper Sandler, corporate profit growth will slow this year, and may contract in 2023. The company’s research team predicts foreign profits to get hit much harder than U.S. domestic earnings. Eurozone profits are set to slow to 10% year-over-year in December 2022 and decline a sharp 36% in July 2023. Eurozone Manufacturing PMI could slide to 39 in the first quarter of 2023 from the latest reading of 56.5 in March.
- China continues to report record high COVID cases, and many cities remain under lockdowns. This will play into a growth slowdown and continued supply chain pressure. FactSet reported that China already cut LNG purchases on soaring prices and COVID slowdowns.
- The Pentagon says it is monitoring claims that Russian forces deployed a poisonous substance in the besieged eastern Ukrainian city of Mariupol, which if confirmed as a chemical weapon, could further escalate the war.
Energy & Natural Resources
Strengths
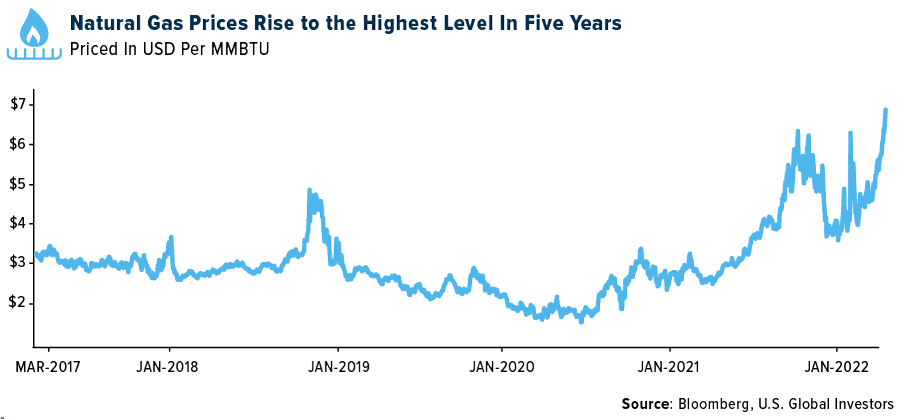
- The best performing commodity for the week was natural gas, up 16.92%. U.S. natural gas closed at the highest level in more than 13 years, reaching prices not seen since before the shale revolution. That revolution of abundant production for the U.S. and cheap prices has shifted to “global supply crunch” as the rest of the world want’s our natural gas and will bid a much higher price to secure those future supplies.
- Glencore and General Motors have agreed to a multi-year supply contract for cobalt to be supplied from the Murrin Murrin Operation in Australia. The deal with Glencore will meet about 70% of General Motors’ expected demand, thus supplies of cobalt remain tight. General Motors plans to produce 1 million electric vehicles by 2025.
- Diamonds are making a comeback. De Beers sold $565 million worth of rough-cut stones during its third sale of 2022. The prior auction fetched $552 million and year-ago sales only hit $450 million.
Weaknesses
- The worst performing commodity for the week was lumber, down 6.41%. High inflation and the Federal Reserve looking to put the brakes on rising prices took its toll on lumber this week as buyers get priced out of the market for new homes. Oil resumed its decline as China’s virus resurgence worsened, raising concerns about demand from the world’s biggest crude importer, reports Bloomberg. West Texas Intermediate futures slid to the lowest level since late February. Virus cases continue increasing in Shanghai, and there is no clarity on when restrictions will be lifted. The flare-up has led to disruptions at ports and prompted some refiners to trim operating rates.
- On-warrant holdings of zinc on the London Metals Exchange (LME) have sunk precipitously low and has traders and regulators watching closely, post the nickel trading fiasco. Trading in nickel on the LME has not returned in any type of robust fashion. With the LME no longer member-owned, its integrity to honor all counterparties equally is in serious doubt.
- Aluminum slumped in London as COVID flareups in China weighed on the outlook for demand, setting the stage for a potential loosening in spot supply. Virus infections in Shanghai, the financial center that accounts for 3.8% of the country’s GDP, hit record levels amid an extended lockdown of the city’s 25 million people. The lockdowns threaten to exacerbate supply-chain snarls.
Opportunities
- Jeff Currie of Goldman Sachs Group discussed the “volatility trap” scenario he sees playing out between soaring commodity prices and sluggish decisions to bring on new production. Soaring commodity prices lures producers to invest in new capacity, however, that same volatility in price creates a fear response to not invest due to a potential collapse. Currie believes we are in the early innings of a commodity supercycle and worries investors will be wary of funding for new production versus demanding a dividend.
- According to Morgan Stanley, even prior to the Russia/Ukraine conflict, the global LNG market was tightening. The COVID-driven price collapse in 2020 drove a wave of project delays and cancellations, while demand continued to grow. By 2021, this pushed the market into a multi-year upcycle with higher, more volatile prices. Now, Europe’s pivot away from Russian natural gas will require even more LNG, adding strain to an already tight market.
- Morgan Stanley also commented that Russia produces about 8% of the world’s LNG and announced plans to expand this to 15% by 2030. This now looks ambitious with global sanctions in place and companies and technology leaving the country as a result. The supply response for gas looks set to fall to other regions. That said, a rush of new LNG project approvals from Asia Pacific is unlikely – which is a tailwind for incumbent producers.
Threats
- U.S. shale companies are not on a path toward structurally higher earnings power, says Morgan Stanley. The market’s impulsive reaction to the issues in Russia has been to quickly discount higher U.S. oil and gas activity. Some have highlighted the potential for a shift in industry and policy circles regarding the value of investment in U.S. onshore assets. The group notes: 1) producer capital spending has been less constrained by restrictive policy than by investor demands for better returns and 2) the service industry is facing legitimate constraints in growing activity levels due to commodity and labor shortages.
- Purdue published its March Ag Economy Barometer which includes a monthly survey of 400 agricultural producers on economic sentiment. Not surprisingly, 27% of U.S. crop producers had difficulties in purchasing crop inputs from their suppliers for the 2022 planting season. The herbicide supply chain is most problematic, followed by fertilizer and farm machinery parts. Higher input costs continue to be the number one concern for farmers based on 63% of survey responses followed by crop prices (33%).
- Dotting the sea off Chinese ports are 477 bulk cargo ships waiting to deliver resources from metal ore to grain into the country. Queues of vessels carrying raw materials have jumped after Shanghai initiated a city-wide lockdown at the end of last month to combat COVID. More than two weeks on, the congestion has expanded to nearby Ningbo-Zhoushan as ship-owners desperately divert ships to other ports in the country to avoid the trucker shortage and warehouse closures in Shanghai.
Domestic Economy & Equities

Strengths
- Continued unemployment claims declined to 1,475,000 from the prior week’s 1,523,000. However, initial jobless claims rose to 185,000, above consensus for 175,000.
- The University of Michigan’s gauge of consumer sentiment came in at 65.7 in April, ahead of consensus for 59.0 and March’s final reading of 59.4.
- Delta Air Lines was the best performing S&P 500 stock for the week, gaining 15.30%. Most airline stocks jumped after Delta reported a quarterly loss but said it returned to profitability in March and expects to report a second-quarter profit. Shares of American Airlines gained 14.56%, Southwest 13.39% and Alaska Air shares rose by 9.22%.
Weaknesses
- Inflation in March increased by 8.5% on a year-over-year basis, above the expected 8.4%. This is the highest CPI inflation reading since 1981, mostly caused by higher energy prices. Core inflation (excluding food and energy) increased 6.5%, below the expected increase of 6.6%.
- The nation’s largest bank by assets, JPMorgan, said its first quarter profits dropped by 42% from last year, partly because the bank wrote down nearly $1.5 billion in assets due to higher inflation and Russia’s war with Ukraine. Loan growth disappointed and earnings per share missed.
- Generac Holdings, a portable generator producer, was the worst performing S&P 500 stock for the week, losing 12.60%. Shares declined more than 6% on Thursday, falling to the lowest intraday level since January 28. On April 11, Oppenheimer cut its price target on Generac to $400 from $450 on rising rates.
Opportunities
- Morgan Stanley reported a drop in first quarter profit but still beat estimates thanks to strong trading revenue. Goldman Sachs also reported a decline in profits but had strong trading revenue. Morgan Stanley results, released on Thursday, showed better-than-expected bank revenue from trading activities as well. Trading revenue may continue to be a bright spot for other banks as the war in Europe creates more volatility.
- U.S. President Joe Biden announced $800 million in additional military aid for Ukraine, a day after accusing Vladimir Putin’s forces of committing genocide in Ukraine. Russia’s military committed war crimes by targeting civilians, according to a report by the Organization for Security and Co-operation in Europe. United international support for Ukraine will put Russia in the corner, ending the war.
- Manufacturing and Service PMIs should remain well above the 50 level, which should further prove the resilience of the domestic market facing rising rates and inflation. Data will be released on April 22.
Threats
- Economists are predicting a 50 basis points hike in May and June, according to a Reuters poll. We have seen a pickup in both recession calls and concerns about a central bank policy mistake, with heavier focus on a hawkish Fed policy shift.
- JPMorgan’s Marko Kolanovic, who has been among the most bullish strategists, wrote this week that investors should take some profits after U.S. stocks staged a rally last month as risks remain elevated around geopolitics, policy tightening, and growth. However, JPMorgan is still “pro-risk” and holds an overweight recommendation on equities as it sees support in part from a solid labor market, healthy consumer market and corporate balance sheets.
- Amazon will charge businesses that sell products on its website a 5% fuel and inflation fee beginning April 28, according to documents reviewed by Bloomberg, a first for the company. Inflation has spiked in recent months, and energy prices have surged since Russia invaded Ukraine. Uber Technologies and Lyft both added fuel surcharges last month to offset rising costs. More companies will follow these procedures, which will result in higher prices for the end customers.
Blockchain and Digital Currencies
Strengths
- Of the cryptocurrencies tracked by CoinMarketCap, the best performer for the week was Luniverse, rising 2,885.76%.
- According to an article written by Bloomberg, Circle Internet Financial, the issuer of USD coin, the second largest stablecoin, landed $400 million in funding from a group that includes Blackrock Inc. and Fidelity Management and Research LLC. The funding is a clear sign of traditional finance’s growing acceptance of the exploding cryptocurrency industry.
- The owner of the biggest Brazilian-based cryptocurrency brokerage is in talks to create a new crypto-focused asset manager, writes Bloomberg. 2TM Participacoes SA is seeking to join with Giant Steps Capital, Latin America’s biggest quantitative asset manager on the new project.
Weaknesses
- Of the cryptocurrencies tracked by CoinMarketCap, the worst performing for the week was Mini Cat Coin, down 99.51%.
- Bitcoin dropped below $41,000 for the first time in about three weeks, sliding further on mounting concerns about rising interest rates. The largest cryptocurrency fell as low as $40,996 on Monday, retreating for the seventh day in the past eight, writes Bloomberg.

- On Thursday, Bitcoin fell below $40,000 and weakened 3.1%. Prices fluctuated 3.8%, trading between $39,965 and $41,500. Bitcoin is now 42% below the high of $68,992 reached on November 10 and has weakened 14% so far this year, writes Bloomberg.
Opportunities
- Uniswap Labs, the main developer of the biggest decentralized exchange for spot-market cryptocurrency trading, is launching computer code that can embed its capabilities into any website, writes Bloomberg. The widget is a key part of Uniswap’s growth strategy which recently led to the company’s launch of a venture arm to invest in Web3 startups.
- Internet casinos that offer users a way to gamble using cryptocurrencies are booming, reports NBC News, sidestepping regulations while operating and advertising with near impunity. Advertising all manner of casino games, these websites often take typical payment methods such as credit cards in addition to Bitcoin and Ether, which can be used on digital versions of slots and roulette, the article continues.
- After releasing the first Amazon shareholder letter since taking over Jeff Bezos’ role as CEO in July of 2021, Andy Jassy says that the international online retail platform could potentially sell NFTs in the future. Despite showing no concrete plans to add digital assets to its e-commerce marketplace in the near future, Amazon appears intent on adding Web3 technology into its business model, writes Bloomberg.
Threats
- Bitcoin’s tendency to move in tandem with technology stocks means the biggest cryptocurrency may slump to $30,000 by June, according to Arthur Hayes, the co-founder of crypto trading platform BitMEX. Hayes, in a blog post on Monday, also said the same dynamic could drive Ether to $2,500, writes Bloomberg.
- Former Ethereum developer Virgil Griffith is set to face sentencing in a New York courthouse on April 12 after pleading guilty to one count of conspiracy to violate international sanctions against North Korea last September, writes Bloomberg. U.S prosecutors accused Griffith of teaching North Koreans how to evade sanctions – a violation of the International Emergency Economic Power Act.
- The U.S. government drew a connection between the North Korean hacking unit Lazarus Group and last month’s exploit of Axie Infinity’s Ronin sidechain network, reports The Block. The Treasury Department included the Ethereum address in a sanctions list update. As reported at the time, the exploit resulted in the loss of 173,600 ETH and 25.5 million worth of the stablecoin USDC, the article continues.
Gold Market
This week gold futures closed at $1,975.60, up $30.3 per ounce, or 1.56%. Gold stocks, as measured by the NYSE Arca Gold Miners Index, ended the week higher by 3.08%. The S&P/TSX Venture Index came in up just 0.48%. The U.S. Trade-Weighted Dollar rose 0.52%.
| Date | Event | Survey | Actual– | Prior |
|---|---|---|---|---|
| Apr-7 | Initial Jobless Claims | 200k | 166k | 171k |
| Apr-12 | Germany CPI YoY | 7.3% | 7.3% | 7.3% |
| Apr-12 | Germany ZEW Survey Expectations | -48.5 | -41.0 | -39.3 |
| Apr-12 | Germany ZEW Current Situation | -35.0 | -30.8 | -21.4 |
| Apr-12 | CPI YoY | 8.4% | 8.5% | 7.9% |
| Apr-13 | PPI Final Demand YoY | 10.6% | 11.2% | 10.0% |
| Apr-14 | ECB Main Refinancing Rate | 0.000% | 0.000% | 0.000% |
| Apr-14 | Initial Jobless Claims | 170k | 185k | 166k |
| Apr-17 | China Retail Sales YoY | -3.0% | — | 1.7% |
| Apr-19 | Housing Starts | 1745k | — | 179k |
| Apr-21 | Eurozone CPI Core YoY | 3.0% | — | 3.0% |
| Apr-21 | Initial Jobless Claims | — | — | 185k |
Strengths
- The best performing precious metal for the week was silver, up 3.90%, likely on the stronger inflation data reported this week, which of course silver loves. Technically, $26.00 continues to act as major resistance to a price breakout. Purchases of gold exchange-traded products (ETPs) hit a record in March, while investors pulled record amounts from domestically-listed European equity funds as the fallout from Russia’s invasion of Ukraine ripped through markets. Global net inflows into gold ETPs rose five-fold month-on-month to $11.3 billion in March, according to data from BlackRock, eclipsing the previous peak of $9.4 billion in July 2020. The surge in buying helped push the gold price to within a whisker of its all-time high in early March, although it has since eased back, reports the Financial Times.
- Nomad Royalty reported strong first quarter 2022 preliminary results with attributable revenue of approximately $12.7 million from 6,604 attributable ounces sold. Ounces came in sequentially higher this quarter, and now represent 26% of full year guidance at midpoint, according to the company.
- Perseus Mining reported ongoing infill and extension drilling on the CMA structure at Yaouré gold mine in Côte d’Ivoire. Managing Director Jeff Quartermaine noted they were working towards a resource upgrade to complete a Pre-Feasibility Study. The Bank of Ghana has set aside 180 million Cedis for gold purchases. Ghana is Africa’s top gold producer and has bought over 600 kilos since it started its purchase program back in June.

Weaknesses
- The worst performing precious metal for the week was palladium, off 2.83%. The London Platinum & Palladium Market (LPPM) followed the London Bullion Market Association (LBMA) in suspending the accreditation of Russian refineries. More specifically, the LPPM suspended the government owned Krastsvetmet refinery and the Piroshky Plant of Non-Ferrous Metals from its Good Delivery and Sponge Accreditation lists. Relative to the suspensions in gold and silver, this action from the LPPM could have far more serious price implications. These two refineries process Russia’s 3 million ounces of annual palladium production and 700,000 ounces of annual platinum production.
- New Gold reported Q1 gold equivalent production that was 21.4% lower than the prior quarter. Production was down at both their mines, with New Afton’s production off 32.3% while Rainy River’s slide 15.0%. New Gold is rated an underperform by BofA Securities.
- Galiano Gold still struggles to regain investor confidence. This week Raj Ray downgraded Galiano Gold from a Market Perform to an Underperform. In late February, Galiano Gold noticed in February that the grade of gold going to its tailing waste contained 0.40 g/t, far exceeding the expected grade of 0.10%. Ray noted in his report that the new Measured and Indicated grade were about 20% lower than the previous report which management explained as an update to the geologic model. Go figure.
Opportunities
- South Africa was last ranked 75th out of 84 jurisdictions as surveyed by the Fraser Institute Annual Survey of Mining Companies 2021. This underscores how unattractive the region has been to new mining investments due to electricity shortages, frequent strikes and community unrest. This week South African Department of Minerals and Energy unveiled its exploration strategy which aims to attract $900 million of annual investment in exploration in its substantial mineral wealth by removing bottlenecks, improving resource-mapping and diversifying its focus beyond gold. With South Africa’s declining gold resources, the department stressed their focus is on the minerals of the future. Just in 2019, South Africa was ranked 40th out of 76 in the Fraser survey.
- Shares of Asian and South African companies tied to platinum group metals rose after the London market suspended two state-owned Russian palladium refiners from its accreditation lists. The move potentially disrupts supplies from the world’s biggest producer of the precious metal; Russia produces 40% of all freshly mined palladium.
- High commodity prices are boosting mining profits, and companies are opting to give the money back to shareholders rather than invest in new projects, which could slow global production growth. Last year was spectacular for mining groups as they benefited from a post-pandemic recovery in demand. Earnings soared as a result, and much of it went into shareholders’ pockets.
Threats
- Barrick Gold reported preliminary production for gold and copper that were inline with expectations. Gold production dropped versus the prior quarter but was telegraphed earlier. Surprising, though, was the roughly 20% higher costs guidance framed for analysts. Inflation is certainly impacting costs as diesel fuel prices soared in March, likely hitting the open pit miners harder than underground operations.
- Barrick Gold also reported that it has reengaged with Pakistan’s government on a revised plan to develop the giant Reko Diq copper gold deposit that is close to the border with Iran and Afghanistan. The project is envisioned to be built in two stages with a capital requirement of $7 billion. Barrick recently announced a $1 billion stock buyback. If Jeff Currie is right about being in the early innings of a commodity supercycle, investors will be warried of funding for this project for new production versus demanding a dividend or buyback.
- Some of Russia’s palladium exports could be redirected to China following the London Platinum and Palladium Market’s suspension of two state-owned refiners, according to UBS Group AG, which could put the brakes on a panicked market. China, which consumes about three million ounces of palladium annually, uses slightly more than what Russia produces, said Giovanni Staunovo, a strategist at the bank’s global wealth management unit.
U.S. Global Investors, Inc. is an investment adviser registered with the Securities and Exchange Commission (“SEC”). This does not mean that we are sponsored, recommended, or approved by the SEC, or that our abilities or qualifications in any respect have been passed upon by the SEC or any officer of the SEC.
This commentary should not be considered a solicitation or offering of any investment product. Certain materials in this commentary may contain dated information. The information provided was current at the time of publication. Some links above may be directed to third-party websites. U.S. Global Investors does not endorse all information supplied by these websites and is not responsible for their content. All opinions expressed and data provided are subject to change without notice. Some of these opinions may not be appropriate to every investor.
Holdings may change daily. Holdings are reported as of the most recent quarter-end. The following securities mentioned in the article were held by one or more accounts managed by U.S. Global Investors as of (03/31/2022):
Spirit Airlines
JetBlue Airways Corp.
Allegiant Travel Co.
Ryanair Holdings
Southwest
Alaska Air Group
Amazon.com Inc.
Nomad Royalty Co. Ltd.
Perseus Mining Ltd.
Barrick Gold Corp.
*The above-mentioned indices are not total returns. These returns reflect simple appreciation only and do not reflect dividend reinvestment.
The Dow Jones Industrial Average is a price-weighted average of 30 blue chip stocks that are generally leaders in their industry. The S&P 500 Stock Index is a widely recognized capitalization-weighted index of 500 common stock prices in U.S. companies. The Nasdaq Composite Index is a capitalization-weighted index of all Nasdaq National Market and SmallCap stocks. The Russell 2000 Index® is a U.S. equity index measuring the performance of the 2,000 smallest companies in the Russell 3000®, a widely recognized small-cap index.
The Hang Seng Composite Index is a market capitalization-weighted index that comprises the top 200 companies listed on Stock Exchange of Hong Kong, based on average market cap for the 12 months. The Taiwan Stock Exchange Index is a capitalization-weighted index of all listed common shares traded on the Taiwan Stock Exchange. The Korea Stock Price Index is a capitalization-weighted index of all common shares and preferred shares on the Korean Stock Exchanges.
The Philadelphia Stock Exchange Gold and Silver Index (XAU) is a capitalization-weighted index that includes the leading companies involved in the mining of gold and silver. The U.S. Trade Weighted Dollar Index provides a general indication of the international value of the U.S. dollar. The S&P/TSX Canadian Gold Capped Sector Index is a modified capitalization-weighted index, whose equity weights are capped 25 percent and index constituents are derived from a subset stock pool of S&P/TSX Composite Index stocks. The NYSE Arca Gold Miners Index is a modified market capitalization weighted index comprised of publicly traded companies involved primarily in the mining for gold and silver. The S&P/TSX Venture Composite Index is a broad market indicator for the Canadian venture capital market. The index is market capitalization weighted and, at its inception, included 531 companies. A quarterly revision process is used to remove companies that comprise less than 0.05% of the weight of the index, and add companies whose weight, when included, will be greater than 0.05% of the index.
The S&P 500 Energy Index is a capitalization-weighted index that tracks the companies in the energy sector as a subset of the S&P 500. The S&P 500 Materials Index is a capitalization-weighted index that tracks the companies in the material sector as a subset of the S&P 500. The S&P 500 Financials Index is a capitalization-weighted index. The index was developed with a base level of 10 for the 1941-43 base period. The S&P 500 Industrials Index is a Materials Index is a capitalization-weighted index that tracks the companies in the industrial sector as a subset of the S&P 500. The S&P 500 Consumer Discretionary Index is a capitalization-weighted index that tracks the companies in the consumer discretionary sector as a subset of the S&P 500. The S&P 500 Information Technology Index is a capitalization-weighted index that tracks the companies in the information technology sector as a subset of the S&P 500. The S&P 500 Consumer Staples Index is a Materials Index is a capitalization-weighted index that tracks the companies in the consumer staples sector as a subset of the S&P 500. The S&P 500 Utilities Index is a capitalization-weighted index that tracks the companies in the utilities sector as a subset of the S&P 500. The S&P 500 Healthcare Index is a capitalization-weighted index that tracks the companies in the healthcare sector as a subset of the S&P 500. The S&P 500 Telecom Index is a Materials Index is a capitalization-weighted index that tracks the companies in the telecom sector as a subset of the S&P 500.
The Consumer Price Index (CPI) is one of the most widely recognized price measures for tracking the price of a market basket of goods and services purchased by individuals. The weights of components are based on consumer spending patterns. The Purchasing Manager’s Index is an indicator of the economic health of the manufacturing sector. The PMI index is based on five major indicators: new orders, inventory levels, production, supplier deliveries and the employment environment. Gross domestic product (GDP) is the monetary value of all the finished goods and services produced within a country’s borders in a specific time period, though GDP is usually calculated on an annual basis. It includes all private and public consumption, government outlays, investments and exports less imports that occur within a defined territory.
M2 Money Supply is a broad measure of money supply that includes M1 in addition to all time-related deposits, savings deposits, and non-institutional money-market funds.
The misery index is meant to measure the degree of economic distress felt by everyday people, due to the risk of (or actual) joblessness combined with an increasing cost of living. The misery index is calculated by adding the unemployment rate to the inflation rate.


