
The AI Era Unleashed: How NVIDIA’s Stock Boom Reflects the Future of Tech
If you were doubting whether the age of AI has arrived, NVIDIA’s stock performance this week may have given you second thoughts.
If you were doubting whether the age of AI has arrived, NVIDIA’s stock performance this week may have given you second thoughts.
Shares of the Santa Clara, California-based chipmaker rocketed up more than 24% on Thursday, marking one of the top five biggest one-day market cap gains of any publicly traded U.S. company ever. With an approximately $957 billion valuation, NVIDIA may soon join the likes of Apple, Microsoft, Alphabet and Amazon in the highly exclusive $1 trillion+ club.
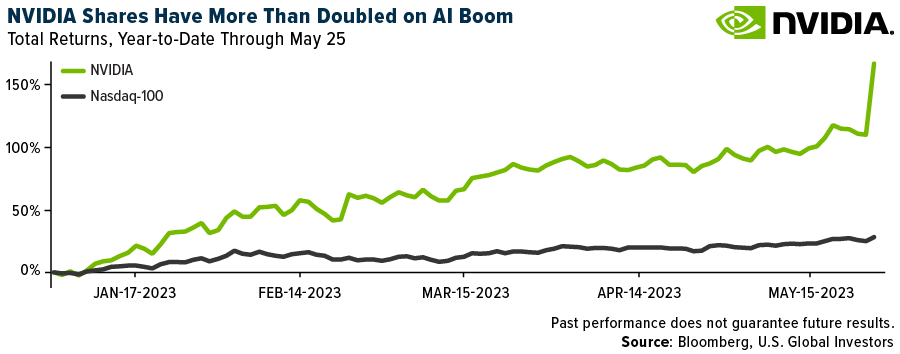
Year-to-date through today, NVIDIA’s stock has returned more than 160%, compared to the tech-heavy Nasdaq, up around 30% over the same period.
So what’s going on? The U.S. Treasury could run out of cash as soon as next week, the yield curve is flashing a recession and household debt now tops $17 trillion. Is this more “irrational exuberance”?
That’s hard to say in the short term, but over the long term, I believe a bet on semiconductors, artificial intelligence and data centers is looking more and more attractive as AI is set to be applied to countless functions. NVIDIA is just one way to play it.
ChatGPT Leads the Race in Generative AI… For Now
NVIDIA reported blockbuster results in the quarter ended April 30, logging net income of over $2 billion, a 26% increase over the same period last year. Data center revenue hit a record $4.28 billion during the quarter, with founder and CEO Jensen Huang stating that “a trillion dollars of installed global data center infrastructure will transition from general purpose to accelerated computing as companies race to apply generative AI into every product, service and business process.”
Today, when most people hear “generative AI,” they probably think of ChatGPT, the large language model (LLM) launched by OpenAI in November 2022. (Midjourney, a generative AI program that creates images from text, was used to make today’s header image.) As I shared with you before, ChatCPT reached 100 million active users in as little as two months (for comparison’s sake, it took TikTok nine months to reach that goal), and it attracted 1 billion visitors to its website in February.
But ChatGPT is only the start, just as America Online (AOL) was many people’s first gateway into the internet 25 to 30 years ago. Over the coming months and years, I expect to see an eruption of new AI-focused companies and applications.
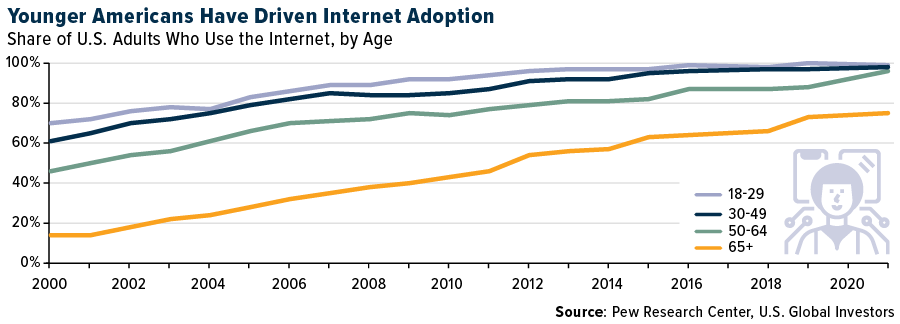
According to a Pew Research survey, almost 60% of U.S. adults have heard of ChatGPT, but only 14% have actually used it. Just as we saw during the early days of the internet, younger Americans have been far more likely to try ChatGPT than their older peers. Nearly one in three (31%) Americans under 30 reported using the app, compared to only 4% of those age 65 and older.
An Insatiable Appetite for GPUs
What does this have to do with NVIDIA? Well, ChatGPT requires biblical amounts of processing power. Its latest product, GPT-4, is reportedly trained on a staggering 170 trillion parameters, making its responses sound even more genuine and humanlike than the previous version.
(In case you were wondering, ChatGPT was not used to write this. But then, how would you know for sure? One study found that over 63% of Americans can’t tell the difference between human-generated content and AI-generated content.)
Since OpenAI is a private company (valued at $30 billion in January), verifiable data is hard to come by, but according to an estimate by UBS, ChatGPT uses 10,000 NVIDIA graphics processing units (GPUs)—with the potential for thousands more as the model becomes more sophisticated and the number of active users grows.
In other words, if AI were the California Gold Rush, then NVIDIA would be the biggest seller of picks and shovels.
Investing in Data Centers
Besides chipmakers, another way to play the AI boom is with data centers, which can feature utility-like cash flows. Virginia hosts the largest concentrated data center market in the world, with Northern Virginia home to data centers operated by Microsoft, Amazon Web Services (AWS), Google, Visa and many more.
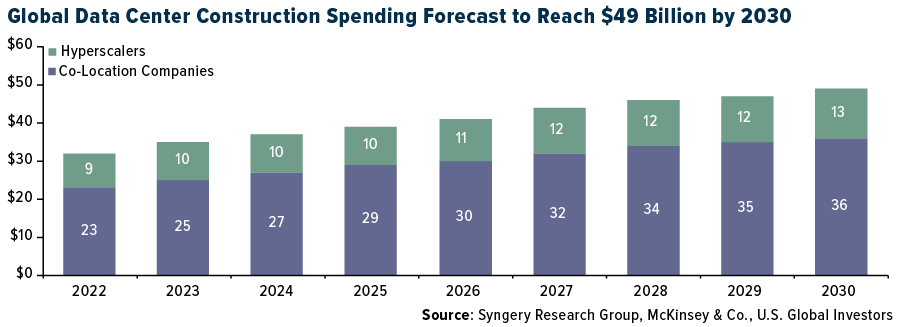
By 2030, global demand for data centers is expected to reach 35 gigawatts (GW), up from 17 GW in 2022, according to McKinsey. Construction spending could hit $50 billion by 2030, up from around $35 billion today. That would represent a compound annual growth rate (CAGR) of 5.4%.
This week, billionaire real estate investor Kyle Bass told Bloomberg that he likes data centers right now, saying people can’t even finish developing one “before one of the FAANGs leases it for 30 years.”
“Data centers are white-hot,” he added, urging investors to consider them as a way to position for expansion in AI.

Index Summary
- The major market indices finished mixed this week. The Dow Jones Industrial Average lost 1.00%. The S&P 500 Stock Index rose 0.35%, while the Nasdaq Composite climbed 2.51%. The Russell 2000 small capitalization index was flat at 0.03% this week.
- The Hang Seng Composite lost 3.95% this week; while Taiwan was up 2.04% and the KOSPI rose 0.83%.
- The 10-year Treasury bond yield rose 12 basis points to 3.80%.
Airlines and Shipping
Strengths
- The top-performing airline stock this week was Azul, with a rise of 14.5%. The Allied Pilots Association, which represents over 15,000 pilots at American Airlines, stated that its negotiating committee had reached a preliminary agreement with the management at American Airlines on a new labor contract. As reported by Reuters and other outlets, this tentative agreement would result in a 21% wage increase for pilots in 2023, followed by a 5% raise in the subsequent year, and annual raises of 4% for the following two years. The agreement also includes pay and profit sharing that “match the top of the industry.”
- According to data from Clarkson, the weekly newbuild price index rose to a new peak of 168.63, up 7% year-on-year, as of mid-May 2023. Breaking it down by vessel types, newbuild price indexes for containerships, LNG carriers, oil tankers and bulk carriers were reported at 102 (unchanged year-on-year), 185 (up 12% year-on-year), 203 (up 8% year-on-year) and 162 (down 3% year-on-year), respectively. This increased newbuild price suggests that shipbuilders are in a strong position due to tight shipyard availability and healthy demand.
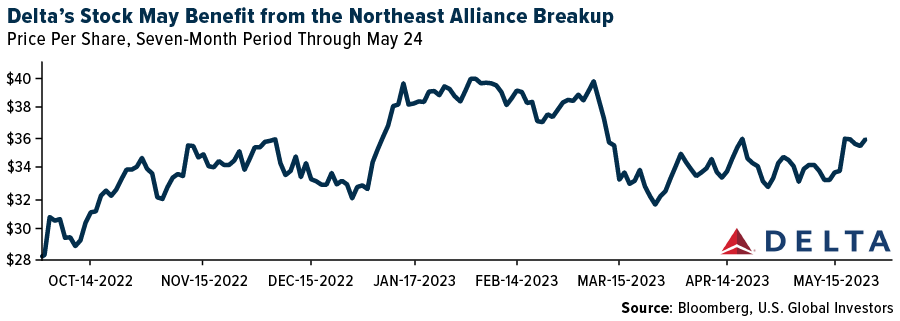
- Delta Airlines has carefully pursued dominance in New York and Boston over the long term, placing it in an optimal position to further capture consumer and corporate spending. The Department of Justice ordered American Airlines and JetBlue to dissolve their Northeast Alliance, making it impossible for either airline to offer the same network and loyalty benefits to passengers that Delta can.
Weaknesses
- The worst-performing airline stock this week was Sabre, with a decrease of 10.2%. WestJet pilots reached an initial agreement that narrowly avoided a strike or lockout, but the company still had to cancel 20% to 25% of flights on May 18 and 19 due to the looming strike. According to a WestJet pilot podcast, the new four-year contract includes an additional C$400 million. This implies a 20% annual cost increase from WestJet’s 2019 pilot costs of C$500 million.
- Modern two-stroke 174,000-ton LNG carriers have experienced a decline in spot rates, from a peak of nearly $500,000 per day to the current rate of $60,000 per day. For older steam-powered vessels, rates have fallen from about $250,000 per day to $27,500 per day. While spot rates have significantly decreased, long-term charter rates, particularly for modern efficient ships, have remained stable at approximately $150,000 per day for modern vessels and $85,000 per day for steam-powered ships.
- The Sunday Times reports that Wizz Air still owes the British public almost 5 million pounds in refunds, despite the airline’s assurance that it was working to resolve all outstanding county court judgments (CCJs). Until May 5, up to four court orders were still being issued daily. Their investigation found 881 county court judgments totaling 4,950,479 pounds outstanding against the airline, with individual claims ranging from 47 pounds to 10,358 pounds.
Opportunities
- Analysts at Morgan Stanley estimate that China’s international air traffic is currently only 30% of pre-COVID levels. They anticipate that it will reach 70-80% of 2019 levels by the end of 2023, and fully recover by mid-2024. Moreover, they predict that China’s international air passenger numbers could double from pre-COVID levels by 2030.
- Clarksons data shows that average sailing speeds in January 2023 were at 14.5 knots for vessels larger than 8,000 twenty-foot equivalent units (TEUs), which is 12% lower compared to the average speed between 2013-2019. While further speed reductions may occur, benefits start to diminish once speeds drop below 13 knots. Assuming that a vessel spends about 30% of its trip duration in port, a further 10% decrease in speed could reduce capacity by an additional 7%.
- According to Morgan Stanley, the reopening of China could represent one of the largest earnings growth opportunities for U.S. network carriers in 2023 and 2024. Beyond 2025, the expanded revenue opportunity should significantly help global airlines flying to the region to achieve consistent profitability, a challenge in the past. They particularly highlight United Airlines, predicting that China could increase from a mid-single-digit percentage of available seat miles (ASMs) and low-single-digit percentage of earnings before interest and taxes (EBIT) to 11% of ASMs and 10% of EBIT in a decade.
Threats
- In their latest earnings call, JetBlue mentioned that the Northeast Alliance was “poised to grow earnings contribution in 2023,” primarily due to “significant New York City growth.” However, with the dissolution of the Northeast Alliance, JetBlue stands to lose these benefits. As a result, there could be a potential risk to JetBlue’s revenue and earnings per share (EPS) projections for 2023, all other factors remaining constant.
- UBS reports recent data suggests U.S./U.K. container import demand is likely to remain weak over the next few months. Concurrently, new vessel deliveries are expected to increase in the second half of the year and the additional benefit from slower sailing speeds may be limited. This supply-demand dynamic may push down the spot freight rate, especially during the trough season starting in October, when demand is traditionally lower.
- The Northeast Alliance allowed American Airlines to access the New York market and provide service to its customers without significant capital investment to build a stronger presence. It enabled American Airlines to redirect regional flights from New York to its hubs, placing customers on JetBlue flights while still earning mileage rewards within the American loyalty program. Now, American Airlines must decide how much presence it needs in New York and how much capital to invest. Depending on American’s response, this capital investment could detract from its free cash flow.
Luxury Goods and International Markets
Strengths
- The United States job market remains robust. Initial jobless claims have decreased to 229,000 from 242,000, falling beneath the expected 245,000. Moreover, continuing claims dipped to 1,794,000 from the previous week’s 1,799,000, which is lower than the forecasted 1,800,000.
- Bloomberg reported this week that a medium-sized classic handbag at Chanel, now priced at 9,700 euros ($10,400) in France, costs about 1,900 euros more than it did 18 months ago. The company typically adjusts handbag prices twice a year, in March and September. Following an average worldwide price increase of 8% in March, Chanel may successfully implement a further price increase later this year as sales continue to thrive.
- Lucid Group, a carmaker, was the best-performing S&P Global Luxury stock in the past five days, gaining 9.6%. In the one-year period, Lucid shares dropped almost 60% and started to bounce at the begging of this year, as the company has been increasing its car production.
Weaknesses
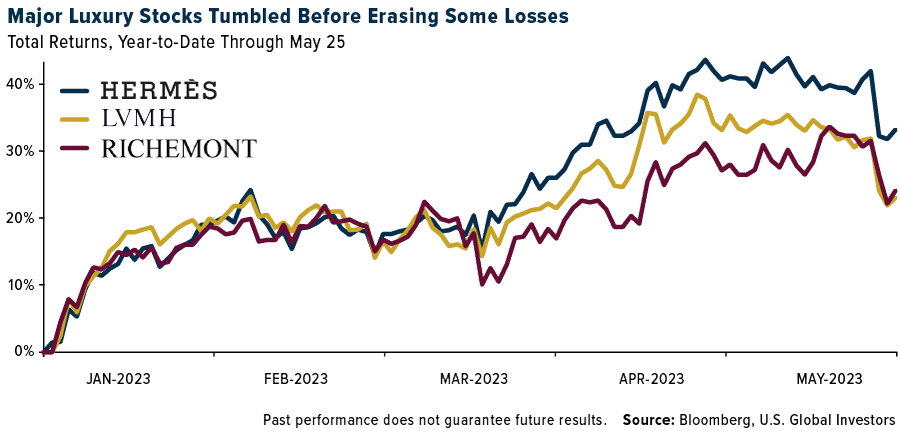
- Luxury stocks took a hit this week. Shares of luxury giants like LVMH fell by 4.3%, Hermes by 3.5% and Compagnie Financiere Richemont by 2.4%. With historically high share prices in the luxury sector, Deutsche Bank suggests investors might become more selective moving forward. The MSCI Europe Textiles Apparel & Luxury Goods Index has risen 20% year-to-date, while the MSCI Europe Index has increased only 10%, and the S&P 500 Index by 8%.
- Germany, the largest economy in Europe, has entered a technical recession. Final gross domestic product (GDP) data released this week indicates that the country’s output fell 0.3% in the first three months of the year, following a 0.5% contraction at the end of 2022.
- Treasury Wine Estates, a wine producer and distributor, was the worst-performing S&P Global Luxury stock in the past five days, losing 13.3%. On Thursday, the company said that inflation was squeezing demand for its commercial-grade wine and is driving up packaging costs. A few analysts revised the company price targets lower.
Opportunities
- As reported by Bloomberg, revenue per available room at Marriott and Hilton may increase 8-13% in 2023 compared to 2022. There’s potential for more substantial gains in Europe and Asia compared to the United States. Recovery in Asia-Pacific has picked up speed following the lifting of Covid-19 travel restrictions in China. Marriott is showing faster year-over-year growth in Asia than other regions, although still falling short of the first quarter of 2019 levels.
- Chanel is expanding its London headquarters, demonstrating confidence in the future of the luxury industry. The fashion giant plans to increase its office space at a new property in the prestigious Berkley Square in Mayfair. The company’s workforce grew to 32,000 last year, with plans to increase this by a further 16% this year. Chanel reported a sales increase of 17% for 2022.
- Bloomberg economists predict a continuing decline in inflation in the eurozone. The year-over-year consumer price index (CPI) may drop to 6.4% in May from 7.0% in April. Core inflation may decrease to 5.5% from 5.6%. These data will be announced on June 1.
Threats
- The pace of recovery has been slow in China, and the government appears hesitant to provide more stimulus. As a result, some investors are tempering their expectations for China’s post-Covid recovery. Moreover, there have been warnings this week of a rise in cases of the Omicron XBB variant in China. Some predict the new cases could surge to 65 million per week by the end of June.
- In the United States, discussions continue around raising the debt ceiling as the country approaches its spending limit. House Speaker Kevin McCarthy has expressed optimism that an agreement can be reached in time, though he acknowledges significant differences still exist between the two sides. Fitch Ratings has put the U.S. on notice for a potential downgrade due to these concerns.
- Manufacturing Purchasing Managers’ Index (PMI) reports for May will be released on June 1 and may confirm the global economic slowdown. The U.S. Manufacturing PMI is likely to remain below the 50-mark threshold, indicating contractionary conditions. Similarly, the EU Manufacturing PMI is expected to hold steady at 44.6, and China’s Manufacturing PMI is also predicted to stay under the 50-mark, suggesting contractionary conditions.

Energy and Natural Resources
Strengths
- The best-performing commodity for the week was corn, rising 9.11% on an extended streak of hot dry weather, such as in North Dakota where the final planting dates to qualify for crop insurance are rapidly approaching, but planting has not begun yet. Estimates of up to 500,000 acres intended for corn will go unplanted. The U.S. is the world’s largest producer of corn.
- Oil prices firmed up this week as Saudi Arabia warned short-sellers and hinted at potential further output cuts. West Texas Intermediate (WTI) futures climbed above $74 a barrel after gaining almost 2% in two days. Market sentiment is influenced by the OPEC+ meeting and a significant drop in U.S. crude inventories. The Department of Energy (DOE) reported gasoline demand was up 7.3% year-over-year (YoY) and up 6.8% versus the five-year average. They also reported diesel demand was up 8.6% YoY and up 8.1% versus the five-year average.
- Albemarle signed a five-year agreement with Ford to provide battery-grade lithium hydroxide for electric vehicle (EV) production. Albemarle committed to supplying over 100,000 metric tons of lithium hydroxide for approximately 3 million Ford EV batteries. The partnership also explores collaborations in lithium-ion battery recycling and emphasizes responsible sourcing and production. Automakers are proactively securing key battery metals to address supply concerns and cost fluctuations.
Weaknesses
- The worst-performing commodity for the week was natural gas, dropping 15.63%, as global gas prices collapsed, a U.S. contract expired and on record U.S. output, rising Canadian exports and forecasts for milder U.S. weather and lower demand in the coming week.
- Copper tax changes are coming to Chile. The new rate of 40% represents a meaningful increase from the current all-in taxation level of 32% to 35%; however, this appears modestly better than the market expectation of 45%. Moreover, the new fiscal regime represents a significant improvement from several previous iterations that were markedly more punitive, particularly at higher copper prices.
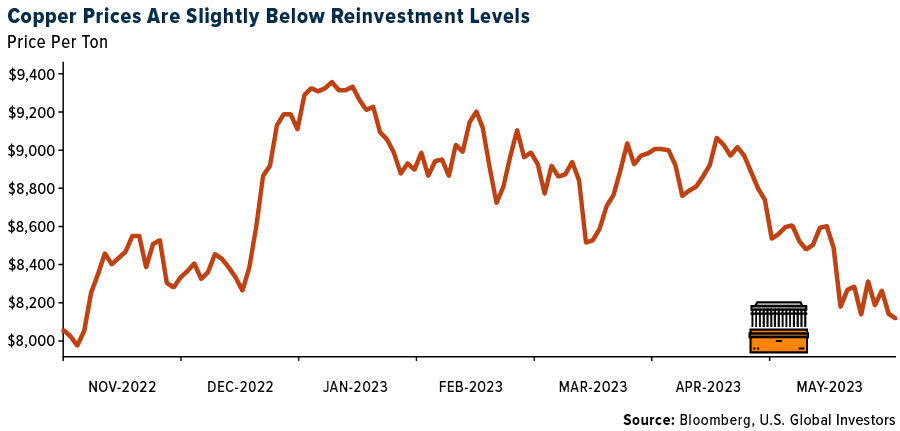
- Copper prices face significant pressures from disappointing macro data in China, dampening expectations for a quick rebound. LME warehouse inventories nearly doubled, indicating a surplus of copper supply relative to end-user demand. Factors like potential monetary tightening, the U.S. debt-ceiling standoff and the absence of big-ticket infrastructure spending announcements in China contribute to the uncertainties and downside risks in the copper market.
Opportunities
- JPMorgan still thinks aluminum prices approaching $2,000 per metric ton are nearing fundamental cost support. While a temporary dive below these levels is possible, without significant moves lower in power or input prices, they would expect monthly average prices to find a floor around these levels in the coming months, aided by boosted consumer hedging flows. Wood Mackenzie’s latest estimates for the 50%-tile of the global aluminum smelting cost curve sits at $1,990 per ton. This mid-point of the cost curve has historically acted as a floor for aluminum prices. Since 1990, aluminum has only traded below this level around 5% of all trading days, compared to 20% of trading days below the 75th %-tile ($2,165/mt currently).
- Longi Green Energy Technology, the world’s biggest solar firm by market value, set a record late last year for silicon cell efficiency — a measure of how much of the sun’s energy gets converted into usable electricity. The record-setting silicon cell efficiency and China’s expected leadership in solar technology position the country to entrench its world-leading position and generate extra power from the same silicon square. This opportunity aligns with global efforts to meet net-zero targets and can drive the growth of China’s solar industry while reducing the cost of electricity.
- The International Energy Agency (IEA) predicts that over $1.7 trillion will be invested in clean energy technologies including solar panels, indicating the growing momentum in renewable energy. Solar power investment is expected to surpass oil production spending this year, highlighting the significant scale and speed of the transition to low-carbon energy sources. The growth in clean energy spending, driven by solar panels and electric vehicles, aims to reduce dependence on fossil fuels and combat carbon emissions and climate change. To meet climate goals and limit global warming, annual clean energy investment will need to double by 2030, presenting further opportunities for solar power expansion.
Threats
- Citigroup forecasts a delay in the recovery of U.S. shale drilling until next year due to lower oil prices and reduced demand. Aggressive energy-transition policies pose a threat to fossil fuel investments and may lead to gas shortages, particularly in Europe, according to Qatar’s energy minister. The energy transition, including the shift to renewables, could impact the demand for natural gas and affect the stability of energy supply in the future.
- Tesla’s potential shift from a 12-volt to a 48-volt low-voltage system in its vehicles may result in reduced copper demand for manufacturing, as lighter battery weight and cost savings are expected. The potential decrease in copper demand from the automotive sector poses challenges for copper producers and suppliers. Changes in copper market dynamics, including bearish price forecasts, weaker Western consumption, and uncertainties surrounding China’s refined import demand, could lead to a challenging phase for the copper industry.
- A key mining region in Myanmar, the world’s third-biggest tin supplier, reaffirmed an order to halt exploration and digging activities from August. An economic planning committee in a northern area of the country controlled by the United Wa State Army — Myanmar’s largest ethnic armed organization — said in a Saturday notice that all mines shall immediately start preparing for the suspension, according to a post on the International Tin Association’s WeChat account Wednesday. The Wa self-ruled areas in Shan state, one of which borders China, accounted for 30% of China’s total supply of tin ore, the ITA said last year.
Bitcoin and Digital Assets
Strengths
- Render was the best-performing cryptocurrency of the week, rising by 20.23%, as tracked by CoinMarketCap.
- According to Bloomberg, attacks on token protocols and crypto projects have dramatically decreased by 70% in the first quarter of 2023 compared to the same period last year. The amount stolen in the first three months of this year is less than any quarter in 2022, suggesting improved security measures and an overall decrease in vulnerabilities.
- Gulf Finance, a joint venture between Binance and Gulf Innova, has received digital asset operator licenses for a digital asset platform from Thailand’s Ministry, as reported by Bloomberg.
Weaknesses
- The worst-performing cryptocurrency for the week, as tracked by CoinMarketCap, was GMX, down by 13.50%.
- Elon Musk cautioned investors against overinvesting in Dogecoin during a virtual conference in London, hosted by the Wall Street Journal.
- The amount of Ethereum available across exchanges dropped to a five-year low on May 26, reducing the total amount of Ethereum held on exchanges to 17.86 million. Bloomberg reports that this significant decline in Ethereum’s exchange supply has not been seen since April 2018.
Opportunities
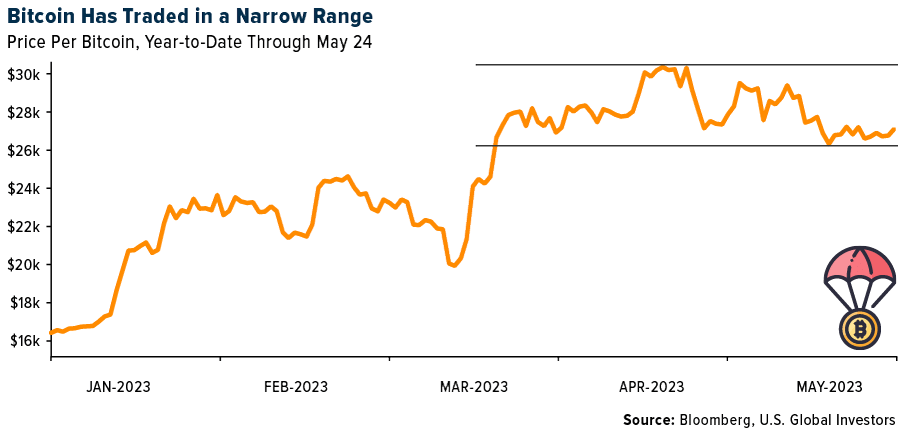
- Bitcoin, an asset known for its volatility, has been consistently trading around $27,000 for three consecutive Tuesdays, suggesting a decrease in its typical volatility, as reported by Bloomberg.
- The Solana Foundation announced the integration of AI into the layer-one blockchain through a new ChatGPT plugin, available for download on Github.
- Bitcoin has been exhibiting less volatility lately, not posting a daily move of 6% for 70 sessions, marking its longest streak of relative calm since October 2020, as per Bloomberg.
Threats
- Bloomberg reports that Shaquille O’Neal allegedly violated securities laws when he sold non-fungible tokens (NFTs) in connection with his Astrals Project. The Astrals NFTs are considered securities that should have been registered before being offered and sold.
- Dubai’s financial regulator warned that global regulatory authorities need to enhance their collaborations to prevent malicious entities from exploiting gaps in cryptocurrency regulations, according to Bloomberg.
- Zcash spot reached a 52-week low at $30.31, with the previous low recorded on March 11. The cryptocurrency has declined by 19.5% year-to-date, with its 52-week high at $66.91, as stated by Bloomberg.

Gold Market
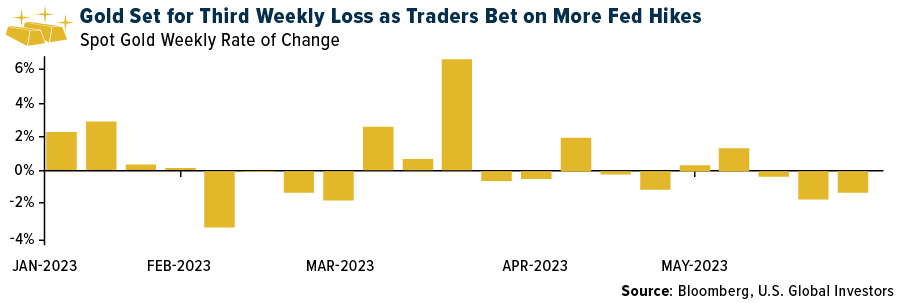
This week gold futures closed the week at $1,965.20, down $35.10 per ounce, or 1.75%. Gold stocks, as measured by the NYSE Arca Gold Miners Index, ended the week lower by 5.31%. The S&P/TSX Venture Index came in off 1.42%. The U.S. Trade-Weighted Dollar rose 0.99%.
Strengths
- The best-performing precious metal for the week was gold, but down 1.75%. The demand for platinum is driven by two key factors:
- 1) The increased platinum loadings needed to meet the China VI standards for heavy-duty vehicles, introduced in 2022, and the expected rebound in Chinese heavy-duty production in 2023. China accounts for 60% of global heavy-duty production.
- 2) The ongoing substitution of platinum for palladium in light-duty gasoline vehicles.
- Goldman Sachs expects a continued focus on mergers and acquisitions due to the supportive gold price environment and strong balance sheet positions. They predict potential impacts to net asset value (NAV) with the proposed implementation of the global minimum tax in 2024. Goldman Sachs continues to view the gold streaming/royalty companies as attractive business models given the elevated gold price environment and flat cost structure, underpinning 70-80% EBITDA (earnings before interest, taxes, depreciation and amortization) margins in their 2023 forecast, which is above the 40-50% EBITDA margins of gold mining peers.
- Fortuna Silver Mines Inc. reported the successful first gold pour at its Seguela Mine in Cote d’Ivoire, marking the mine’s transition from commissioning to the ramp-up phase. The achievement highlights Fortuna’s operational capabilities and adds a fifth operating mine to its portfolio. The company expects the Seguela Mine to contribute a substantial amount of gold production in 2023, showcasing the strength and growth potential of Fortuna’s mining operation.
Weaknesses
- The worst-performing precious metal for the week was palladium, down 6.93%. Gold experienced weakness as revised U.S. data indicates a robust economy, solidifying expectations of monetary tightening. The stronger GDP growth and potential interest rate hikes diminish the appeal of non-interest-bearing gold. The ongoing U.S. debt-ceiling standoff provides limited support to gold as a haven, highlighting a weakness in its performance amidst economic strength and tightening monetary policy.
- Petra Diamonds released sales results for fiscal 2023, which showed signs of a continuously softening diamond market. Like-for-like diamond prices declined by 13%, though overall prices are still up 3% compared to the equivalent five tenders in fiscal 2022. The decline was due to extended shutdowns by certain manufacturers following recent Indian holidays that negatively impacted sales. In April 2023, India reported a nearly 39% year-over-year decline in exports of cut and polished diamonds, highlighting global challenges impacting demand from key markets like the U.S. and China. Additionally, inconsistent Russian rough diamond supply, due to global sanctions on Russian rough diamonds, also had a major impact.
- Superior Gold produced 14,400 ounces of gold in the first quarter, missing the consensus expectation of 16,400 ounces. After pre-releasing January production results of 5,942 ounces, these results suggest a notable decline in production in February and March. Cash costs of $1,969 per ounce represented a 6% drop from the fourth quarter of 2022 but was slightly above the consensus expectation of $1,871 per ounce. With a cash balance of just $3.2 million at the end of the first quarter of 2023, liquidity is a concern.
Opportunities
- Centerra Gold presents an opportunity as a deep-value stock supported by strong cash reserves and gold-in-carbon inventory, with the potential catalyst of EIA approval for the Öksüt gold mine in Turkey. Citigroup’s silver price forecast of reaching $30 per unit within the next six to 12 months adds to the positive sentiment toward precious metals. JPMorgan’s recommendation to increase allocations to gold aligns with the potential for a decline in stocks, offering an opportunity to position defensively and benefit from potential upside in the precious metals market.
- UBS forecasts an even tighter platinum market in 2023. Both platinum and rhodium are expected to be in a slight deficit, with investment demand likely to be a key driver of the platinum market balance. They anticipate increasing risks to near-term supply due to expected power shortages in South Africa over the winter period, potentially intensifying supply concerns against the backdrop of auto-driven demand.
- G2 Goldfields’ ongoing drill program in Guyana showcases significant assay results and the discovery of a second significant zone on the OKO Project. The extended strike length and continuous mineralization at the Ghanie Zone present an opportunity for resource expansion and potential value enhancement. K92 Mining also announced high-grade drilling results from the ongoing exploration at the Kainantu Gold Mine in Papua New Guinea. The drilling showcases the discovery of high-grade mineralization, demonstrates the continuity and expansion potential of vein systems and identifies new mineralization not accounted for in the current resource estimate.
Threats
- For palladium and rhodium, 2023 could mark a return to more regular market conditions following a series of liquidity squeezes from 2019 to 2022. Several market commentators, including Metals Focus and SFA Oxford, have suggested the possibility of large surpluses in these two metals from 2024 onwards. As concerns around availability have faded, prices have trended down, and the incentive for market participants to hold additional metal has subsided.
- According to RBC, 88% of Wheaton Precious Metals’ business comes from offshore-streaming that pays no material taxes via the Cayman Islands (2022 taxes: 0%). A tax gross-up to 15% for Wheaton reduces their net asset value (NAV) valuation by 10% and their 2024/25 operating cash flow (OCF) by 10%. The impact of this change is already well understood and has been confirmed by management at various points since 2021, but it is generally not reflected within consensus forecasts and represents a risk for downward estimate revisions.
- Asante Gold Corporation has announced that Fujairah has advised of a delay in its technical due diligence process due to their consultants’ inability to conduct their site visit and complete this part of its due diligence process.


U.S. Global Investors, Inc. is an investment adviser registered with the Securities and Exchange Commission (“SEC”). This does not mean that we are sponsored, recommended, or approved by the SEC, or that our abilities or qualifications in any respect have been passed upon by the SEC or any officer of the SEC.
This commentary should not be considered a solicitation or offering of any investment product. Certain materials in this commentary may contain dated information. The information provided was current at the time of publication. Some links above may be directed to third-party websites. U.S. Global Investors does not endorse all information supplied by these websites and is not responsible for their content. All opinions expressed and data provided are subject to change without notice. Some of these opinions may not be appropriate to every investor.
Holdings may change daily. Holdings are reported as of the most recent quarter-end. The following securities mentioned in the article were held by one or more accounts managed by U.S. Global Investors as of (03/31/2023):
Delta Air Lines Inc.
American Airlines Group Inc.
JetBlue Airways Corp.
Wizz Air Holdings Plc
United Airlines Holdings Inc.
Newcrest Mining Ltd.
Superior Gold Inc.
Wheaton Precious Metals Corp.
HighGold Mining Inc.
Asante Gold Corp
Amazon.com Inc.
Tesla Inc.
Hermes International
LVMH Moet Hennessy Louis Vuitton SA
Cie Financiere Richemont SA
Marriott International Inc.
Hilton Worldwide Holdings Inc.
Fortuna Silver Mines Inc.
Centerra Gold Inc.
G2 Goldfields Inc.
K92 Mining Inc.
Lucid Group Inc.
*The above-mentioned indices are not total returns. These returns reflect simple appreciation only and do not reflect dividend reinvestment.
The Dow Jones Industrial Average is a price-weighted average of 30 blue chip stocks that are generally leaders in their industry. The S&P 500 Stock Index is a widely recognized capitalization-weighted index of 500 common stock prices in U.S. companies. The Nasdaq Composite Index is a capitalization-weighted index of all Nasdaq National Market and SmallCap stocks. The Russell 2000 Index® is a U.S. equity index measuring the performance of the 2,000 smallest companies in the Russell 3000®, a widely recognized small-cap index.
The Hang Seng Composite Index is a market capitalization-weighted index that comprises the top 200 companies listed on Stock Exchange of Hong Kong, based on average market cap for the 12 months. The Taiwan Stock Exchange Index is a capitalization-weighted index of all listed common shares traded on the Taiwan Stock Exchange. The Korea Stock Price Index is a capitalization-weighted index of all common shares and preferred shares on the Korean Stock Exchanges.
The Philadelphia Stock Exchange Gold and Silver Index (XAU) is a capitalization-weighted index that includes the leading companies involved in the mining of gold and silver. The U.S. Trade Weighted Dollar Index provides a general indication of the international value of the U.S. dollar. The S&P/TSX Canadian Gold Capped Sector Index is a modified capitalization-weighted index, whose equity weights are capped 25 percent and index constituents are derived from a subset stock pool of S&P/TSX Composite Index stocks. The NYSE Arca Gold Miners Index is a modified market capitalization weighted index comprised of publicly traded companies involved primarily in the mining for gold and silver. The S&P/TSX Venture Composite Index is a broad market indicator for the Canadian venture capital market. The index is market capitalization weighted and, at its inception, included 531 companies. A quarterly revision process is used to remove companies that comprise less than 0.05% of the weight of the index, and add companies whose weight, when included, will be greater than 0.05% of the index.
The S&P 500 Energy Index is a capitalization-weighted index that tracks the companies in the energy sector as a subset of the S&P 500. The S&P 500 Materials Index is a capitalization-weighted index that tracks the companies in the material sector as a subset of the S&P 500. The S&P 500 Financials Index is a capitalization-weighted index. The index was developed with a base level of 10 for the 1941-43 base period. The S&P 500 Industrials Index is a Materials Index is a capitalization-weighted index that tracks the companies in the industrial sector as a subset of the S&P 500. The S&P 500 Consumer Discretionary Index is a capitalization-weighted index that tracks the companies in the consumer discretionary sector as a subset of the S&P 500. The S&P 500 Information Technology Index is a capitalization-weighted index that tracks the companies in the information technology sector as a subset of the S&P 500. The S&P 500 Consumer Staples Index is a Materials Index is a capitalization-weighted index that tracks the companies in the consumer staples sector as a subset of the S&P 500. The S&P 500 Utilities Index is a capitalization-weighted index that tracks the companies in the utilities sector as a subset of the S&P 500. The S&P 500 Healthcare Index is a capitalization-weighted index that tracks the companies in the healthcare sector as a subset of the S&P 500. The S&P 500 Telecom Index is a Materials Index is a capitalization-weighted index that tracks the companies in the telecom sector as a subset of the S&P 500.
The Consumer Price Index (CPI) is one of the most widely recognized price measures for tracking the price of a market basket of goods and services purchased by individuals. The weights of components are based on consumer spending patterns. The Purchasing Manager’s Index is an indicator of the economic health of the manufacturing sector. The PMI index is based on five major indicators: new orders, inventory levels, production, supplier deliveries and the employment environment. Gross domestic product (GDP) is the monetary value of all the finished goods and services produced within a country’s borders in a specific time period, though GDP is usually calculated on an annual basis. It includes all private and public consumption, government outlays, investments and exports less imports that occur within a defined territory.
The S&P Global Luxury Index is comprised of 80 of the largest publicly traded companies engaged in the production or distribution of luxury goods or the provision of luxury services that meet specific investibility requirements.


