


Investor Alert
September, the Market’s Most Feared Month, Could Be a Golden Opportunity
Date Posted: September 8, 2023
Read time: 36 min
Even though past performance doesn’t guarantee future results, investors should prepare for continued market volatility this month.
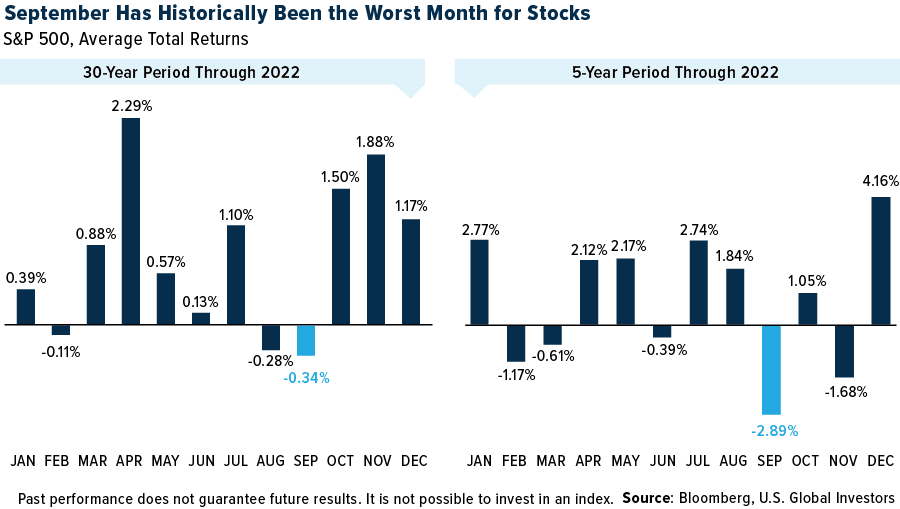
It’s common knowledge that September has historically been a challenging month for stocks, regardless of the timeframe. Since 1928, the S&P 500 has closed down 52 times in September, more than in any other month, according to Yardeni Research. Looking at monthly returns over the past 30 years and five years, equities have had the worst performance during September, dipping 0.34% and 2.89% on average, respectively.
Even though past performance doesn’t guarantee future results, investors should prepare for continued market volatility this month.
At the same time, a close examination of economic indicators and market trends suggests that September could tee up some strategic investment opportunities.
The Recession Narrative Appears to Be Fading
As optimism cautiously returns to Wall Street, new data suggests that fears of an impending recession are receding among some S&P 500 companies.
FactSet reports that significantly fewer S&P 500 companies mentioned “recession” during their second-quarter earnings calls compared to previous quarters. Only 62 companies cited the term, marking a 45% decline from the March quarter and the lowest number since the final quarter of 2021.
A recent study of the economic impact of higher rates offers some context that may help explain companies’ newfound optimism. According to the findings of the Federal Reserve Bank of Chicago, most of the Fed’s rate-hiking policy has already been felt in the broader economy. The labor market will feel a slower impact, with more than half of the total effect on hours worked yet to materialize. However, the report’s authors predict that the existing policy measures should be sufficient to bring inflation close to the Fed’s 2% target by mid-2024—all without triggering a recession.
This could mean that the era of rate hikes is nearing its end, which would likely be a positive development for equities.
Indeed, betting markets seem to believe that the Fed is ready to pause. The probability of the Federal Open Market Committee (FOMC) keeping rates at current levels when its members meet later this month is 95%, according to 30-day Fed Funds futures pricing data. There’s a similarly overwhelming likelihood that rates will be lower one year from now.
Core inflation is reportedly cooling, and this could give the Fed some elbow room. Chair Jerome Powell’s speech at the Jackson Hole Symposium last month was mostly well-received by markets, indicating that the central bank’s policy will remain data-dependent with an aim to tighten only if necessary.
Signs of Resilience in Manufacturing and Services
The health of the U.S. manufacturing and services sectors, even as it remains at historically low levels, is also moving in the right direction, suggesting now may be a good buying opportunity.
The Institute for Supply Management (ISM) reported that the Services Purchasing Managers’ Index (PMI) increased for the third consecutive month in August. A PMI above 50.0 indicates expansion, and the index rose from 52.7 in July to 54.5 in August.
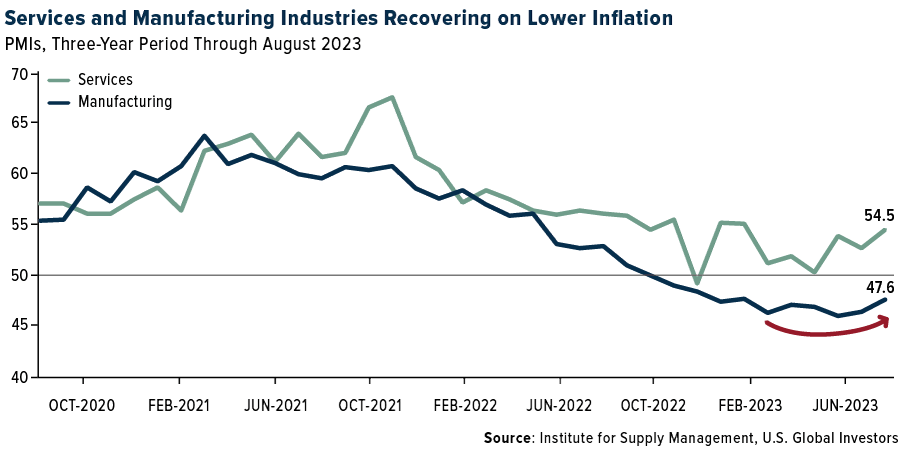
On the manufacturing side, conditions remained below the 50.0 mark for the 10th consecutive month in August, despite showing slight signs of improvement. The PMI stood at 47.6, a small increase from July’s 46.4 and the highest reading since February, indicating a slower pace of contraction.
Overall, both sectors are showing signs of resilience and adaptability as prices gradually come under control. For investors eyeing long-term growth prospects, these subtle but positive shifts could mark a favorable entry point.
Investment Strategies for September… And Beyond
September has a reputation for being a tough month for stocks, but the current economic backdrop suggests that this year might be different. Reduced concerns about a recession, signs of a potential shift in Fed policy and positive sector trends all point to the possibility of strategic investment opportunities.
It’s crucial to approach this with a balanced perspective. Diversification remains key, and investors might consider a mix of asset classes, including equities, fixed income, commodities and, of course, gold to hedge against ongoing uncertainties.
As always, investors should remain vigilant, keeping an eye on inflationary pressures and geopolitical uncertainties that could increase volatility into the markets. A well-considered, data-driven investment strategy could be particularly rewarding in the current environment, offering a way to both manage risk and seize new opportunities.

Index Summary
- The major market indices finished down this week. The Dow Jones Industrial Average lost 0.75%. The S&P 500 Stock Index fell 1.29%, while the Nasdaq Composite fell 1.93%. The Russell 2000 small capitalization index lost 3.61% this week.
- The Hang Seng Composite lost 0.80% this week; while Taiwan was down 0.41% and the KOSPI fell 0.63%.
- The 10-year Treasury bond yield rose 7 basis points to 4.257%.
Airlines and Shipping
Strengths
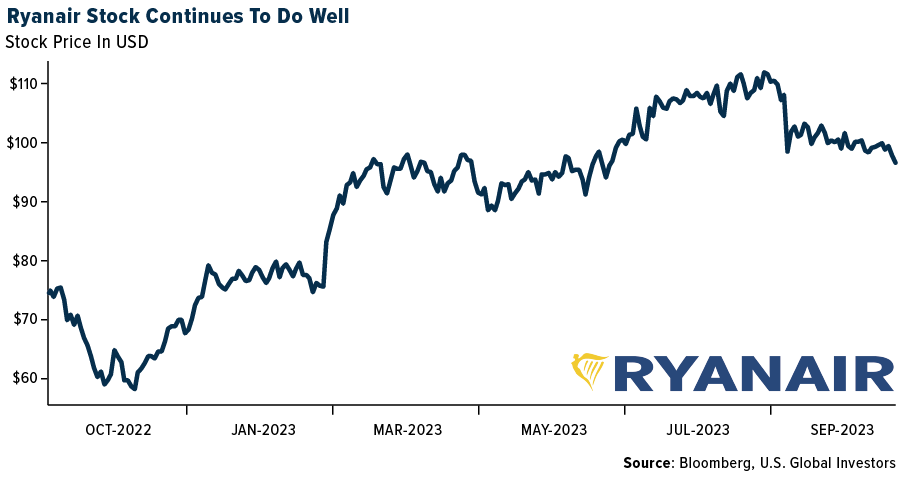
- The best performing airline stock for the week was EasyJet, up 1.50%. Morgan Stanley looked at the potential for cash returns in many sectors and the group believes that eight companies could retire 20% or more of their market cap over the next two years. Ryanair was the only airline making the list.
- According to Morgan Stanley, share prices of Japan’s Big 3 shippers have outperformed TOPIX by 9% in the past month. The bank thinks a primary reason for this is increased appeal amid a shift to value stocks.
- According to Morgan Stanley, winter Jet2 2023/2024 forward bookings are encouraging with average load factors 0.3 percentage points (ppts) ahead of those of winter 2022/23 at the same point, against a 20.4% seat capacity increase to 4.47 million seats, (with the package holiday mix currently up by over 5ppts on winter 2022/23). For both seasons, average pricing to date for both package holidays and flight-only products has remained robust.
Weaknesses
- The worst performing airline stock for the week was JetBlue, down 12.7%. According to ISI, after a strong start to August, TSA throughput decelerated while capacity stayed flat, moderating its estimated load factor. Maui visitors have declined 70%, but it appears the impact on other islands is minimal.
- The Evercore ISI Shipping Cos. Survey continues to trend lower, as the index pulled back from 62.3 to 57.3 over the past week. It should be noted that the survey shed 11.5 points over the past six weeks as slower dry bulk activity combined with late summer tanker softness drove the index lower.
- On Tuesday, United Airlines announced it was “experiencing a systemwide technology issue” that caused a nationwide ground stop, according to various news sources. The ground stop delayed over 200 flights nationwide and lasted less than an hour.
Opportunities
- According to Bank of America, system net sales increased 5.1% year-over-year for the week, compared to an increase of 8.5% last week. While there continues to be strength in overall net sales on a year-on-year basis, the bank notes that the data has decelerated somewhat from levels seen in early to mid-August. That said, sales remain well ahead of the trend seen from early May to early July and the group expects companies to remain positive on demand heading into the fall conference season.
- CIBC continues to see air cargo flight hours stabilize, which the group views as a good proxy for volumes. Cargo flight activity looks to have found a bottom in July with flight departures improving in August. According to Radarbox, cargo flight departures last month were up 7% month-over-month and up 4% year-over-year. For comparison, cargo flight departures in July were flat year-over-year, while in June, flight activity was up 1% year-over-year.
- According to Morgan Stanley, the Ryanair investor day made clear two things: 1) there are significant cash returns on offer in FY24-26, and 2) the next decade’s expansion has been thoroughly planned. With Ryanair’s P/E at historical lows and potential cash returns of 26-34% the market cap over three years, the bank reiterates it as their top pick.
Threats
- According to Goldman, in China the headwinds from visa approval delays, and Chinese travelers’ concerns over public safety in short-haul destinations, could drag the real international passenger traffic lower. Goldman forecasts that spending per passenger may decline by 15% at both Shanghai/ Baiyun airports in 2023E amid weaker demand and consumption downgrades, and it believes it will be hard to return to 2019’s level by 2025.
- JPMorgan isn’t particularly positive about shippers. At DHL the valuation is potentially interesting, though the bank’s expectations are for further downgrades in earnings, particularly in Express. At DSV, the shares seem to be pricing in further M&A in JPMorgan’s view, which leaves little room for upside, and may also produce downside risk if Schenker either doesn’t happen or is viewed as having a poor risk / reward. At Kuehne Nagel, the share price implies a doubling of EBIT versus pre-Covid, with earnings currently on a downward trend.
- Airline stocks continued to decline in August, down 9% after a 5% decline in July and underperforming the S&P 500 by about 8%. Year-to-date, airline stocks are now positive 16%, compared to the S&P 500’s 18% gain, with the group outperforming in January, February, May and June, while underperforming in March, April, July and August.
Luxury Goods and International Markets
Strengths
- With only a few luxury names left to report their latest financial results, yet another luxury company, Tod’s, reported better-than-expected earnings. In the six months ended June 30, the company’s net profit climbed to 30.9 million euros, compared with 800,000 euros last year, on the back of sales that rose 21.7% to 569.1 million euros, (versus 467.5 million euros in the first half last year).
- Tesla reported stronger month-over-month car production out of its plant in China. The company produced 84,159 units from its plant in Shanghai in August, compared to 64,285 in the month of July. So far this year, Tesla has produced 625,000 cars in China, up from about 400,000 over the same period last year, Bloomberg reports. Tesla started producing cars in Shanghai around the end of 2019.
- Shangri-LA Asia Ltd., a hotel and real estate operator, was the best performing S&P Global Luxury stock this week, gaining 4% in the past five days. Last Friday, Bank of America published an update on the company, reiterating a buy recommendation. Shares gained 5% on Monday.
Weaknesses
- China reported weaker service sector data in the month of August. Although the China Service PMI stayed in expansionary territory (above the 50 level) during the month, it unexpectedly fell to 51.8. Consensus was calling for a reading at 53.5. July’s Service PMI was 54.1.
- The Eurozone released a slew of weaker economic data this week, and analysts are pointing to an upcoming recession in the region. The Eurozone Service PMI declined to 47.9 in August from 50.9 in July. The final second-quarter gross domestic product (GDP) came in lower than expected as well. Household consumption was flat. German industrial production for July declined more than expected, remaining more than 7% below the pre-pandemic level, according to FactSet. Citigroup cut the 2023 Eurozone GDP growth forecast to only 0.4% and is expecting the region’s economy to shrink “gently” over the next three quarters.
- Faraday Future Intelligence, an EV maker, was the worst performing S&P Global Luxury stock, losing 47.8% in the past five days. The company announced on Thursday that it suspects a “coordinated effort” to undermine the company’s valuation, initiating an investigation into the matter. Faraday stated its intent to take legal action if it discovers any illegal short-selling, market manipulation, or misinformation, Bloomberg reported. Shares of Faraday lost 81.4% in one month.
Opportunities
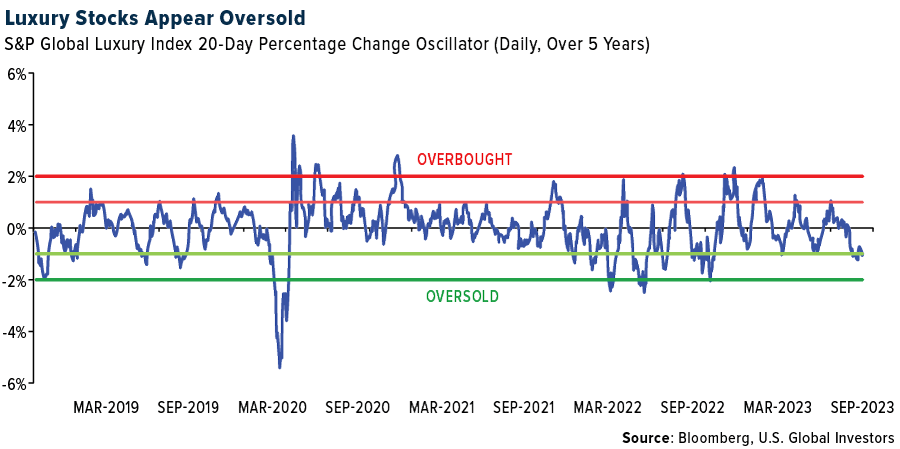
- Year-to-date, luxury stocks, as measured by the S&P Global Luxury Index, gained 11%, but since its peak in mid-July, the index has corrected more than 12%. Our in-house oscillator, seen below, shows the luxury sector falling recently into oversold territory, implying potential buying opportunities and price reversal. Some names are more oversold than others. LVMH for example, the global luxury giant, is one of the most oversold names (with a 20-day sigma at negative 2).
- Consulting firm McKinsey estimates that luxury car sales will grow as much as 8%-14% annually through the early 2030s, contrasting the mainstream car market which is expected to grow very little. Companies are taking the initiative to stay ahead of the growing demand. Toyota, for example, on Wednesday announced its new plug-in hybrid luxury SUV that will become available later this year to customers worldwide. In addition, Mercedes-Benz will start producing its electric G-Class SUV, aka G-Wagen.
- This week, the Parliament in the UK was debating whether to reintroduce tax-free shopping for international visitors. The tax-free shopping was scrapped in the wake of Brexit, disallowing international shoppers to claim back the 20% value-added tax on goods purchased in the UK. However, since the United Kingdon is no longer a part of the Eurozone, it could become a major shopping destination not only for Chinese travelers but for 450 million European residents too.
Threats
- On Wednesday, the chairman of Richemont, the Swiss owner of Cartier, said that inflation is starting to hit luxury demand in Europe. He said that European households are spending a higher percentage of income on necessities than they had in the past decade. Shares of LVMH declined as much as 3.5% that day, reducing the market capitalization to below $400 billion. Due to the recent share price correction, the company is no longer the largest in Europe by market capitalization. Novo Nordisk claimed the number one spot in Europe, with a market cap of $425 billion.
- According to UBS research, Western carmakers’ global market share will decline to 58% from 81% by 2030, losing its global dominance to China. Chinese automakers have a cost advantage over North America and Europe. For example, BYD, a company that makes cars, batteries, and semiconductors in China, has a 15% cost advantage over Tesla’s Chinese-made base Model 3 sedan, and a more than 30% advantage over Volkswagen AG’s ID.3, according to UBS.
- The Chinese economy is slowing down, and property markets continue to alarm investors. Bloomberg calculated that 34 of 50 private-sector developers suffered delinquencies on offshore debt as of September 1. The remaining 16 companies are facing a combined $1.48 billion in bond payments in either principal or interest in September alone.
Energy and Natural Resources
Strengths
- The best performing commodity for the week was crude oil, rising 2.03%, after Saudi Arabia and Russia extended oil cuts until the end of the year. Iron ore rose to the highest since April as investors welcomed China’s efforts to aid the steel-intensive property sector and Country Garden Holdings Co. narrowly avoided a default. The strength in iron ore prices recently prompted China’s government to once again warn market players not to speculate on prices.
- According to RBC, uranium prices were up sharply over the past week as utilities and producers were engaged in the spot market ahead of the major World Nuclear Association (WNA) Symposium in London in September. The strong market activity was preceded by an announcement from Cameco on September 3 that production at the Cigar Lake mine and Key Lake mill have been impacted by ramp-up challenges – the company now expects to produce up to 16.3Mlbs from Cigar Lake/Key Lake, down from the previous forecast of 18Mlbs.
- On September 6, ratings agency Fitch noted in a report that mining companies operating in Chile are well positioned to absorb higher domestic royalties required by a new law in the country. “Chile’s new mining royalty law will not materially weaken the competitiveness of the country’s copper mining sector, but it will increase taxes,” Fitch explains.
Weaknesses
- The worst performing commodity for the week was palm oil, dropping 5.63%, its worst weekly loss in more than four months, according to Bloomberg, on worries over waning demand from India and China, the two biggest importers. Copper and other metals declined as data from China showed a slowdown in the Asian nation’s services, adding to evidence that the economic recovery is struggling for traction and dampening optimism over government stimulus.
- Benchmark gas futures jumped 13% and Asian LNG gained 5% on Friday on the news of Chevron’s liquified natural gas workers starting partial strikes after talks failed to reach a new labor agreement. This will hit consumers but is a tailwind for natural gas producers.
- Australian coal royalties will increase by 2.6 percentage points to between 8.8% – 10.8% from July 1, 2024. New rates will be 10.8% higher for open cut, 9.8% higher for underground, and 8.8% higher for deep underground mining.
Opportunities
- Goldman finds that OPEC production increases are more likely when OECD commercial stocks and Saudi’s market share are low; when time spreads, recent price increases, and positioning are elevated (and when production was increased at the prior meeting). Overall, Goldman’s oil model correctly predicts OPEC decisions to cut, maintain, or boost oil production 62% of the time in a long 1984-2023 sample, and the accuracy rises to 74% in the post-2007 sample. The group still sees a potentially more aggressive OPEC+ price target as the key moderately bullish risk to its 12-month-ahead Brent forecast of $93/bbl.
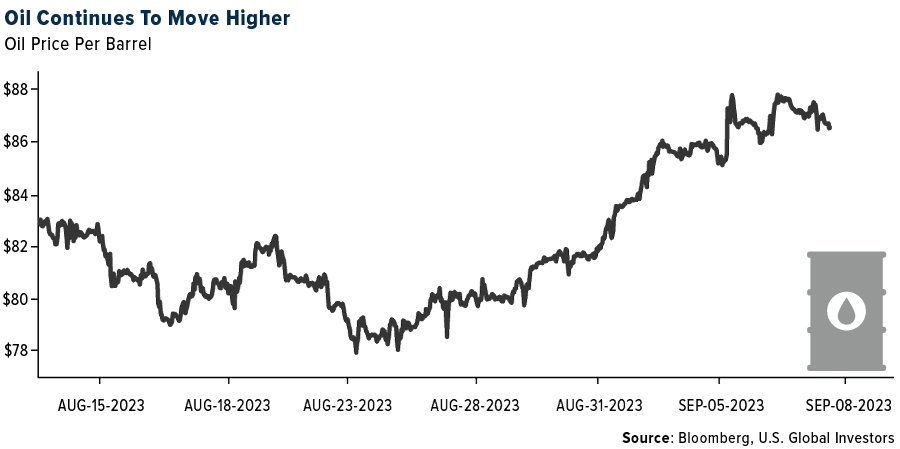
- Saudi Arabia and Russia prolonged their unilateral oil supply curbs by another three months, a more aggressive move than traders had been expecting as the OPEC+ members seek to support a fragile global market. The leader of the Organization of Petroleum Exporting Countries will continue its production cutback of 1 million barrels a day until December, according to a statement published by the state Saudi Press Agency on Tuesday. The move will hold output at about 9 million barrels a day — the lowest level in several years — for six months in total.
- Clean energy developers are expected to install a record amount of solar power in the U.S. this year as the industry recovers from supply-chain and trade obstacles. The solar industry is projected to add 32 gigawatts of capacity in 2023, an amount equal to about 30 new nuclear reactors, according to a report by the Solar Energy Industries Association Inc. and Wood Mackenzie Ltd. The installations will be a 52% increase compared to 2022, when the solar market contracted by 13%, the report said.
Threats
- According to Bank of America, aluminum smelters globally have had little appetite to boost production year-to-date, with supply dropping by 0.5% year-over-year in July. Even in China, where margins have been positive, output fell by 0.6% month-over-month. That said, some of the capacity idled in China’s Yunnan province due to hydro power shortages has restarted, and tonnages should hit the market after the summer. This has various implications including the fact that unless demand strengthens, some of the material Rusal sends to China may not find a home.
- Oil’s sharp rally since late June could be erased in the next six months as weakening demand takes over from supply cuts as the main market driver, according to Gunvor Group Ltd. Parts of Europe are already in recession and the U.S. is likely to slip into a mild one, said Frederic Lasserre, global head of research and analysis at the energy trader. There’s also uncertainty on demand in China, the biggest oil importer, he said in an interview at APPEC by S&P Global Commodity Insights in Singapore on Tuesday.
- Gasoline prices are now at the highest seasonal level in more than a decade even as the Labor Day holiday marked the end of the U.S. summer driving season, sparking fears that inflation could accelerate again. The national average for regular gasoline stands at $3.811 per gallon, topping this time last year and marking the second-highest level in records going back to 1994 from the American Automobile Association.

Bitcoin and Digital Assets
Strengths
- Of the cryptocurrencies tracked by CoinMarketCap, the best performer for the week was Synthetix, rising 14.36%.
- A San Francisco-based technology firm that seeks to help content creators track and monetize their work in the age of generative AI, is bucking a venture capital drought. Story Protocol raised $54 million from a group of investors led by Andreeseen Horowitz that includes Hadhed, Endeavor, Samsung Next, TPG Capital founder David Bonderman and Paris Hilton’s 11:11 media, writes Bloomberg.
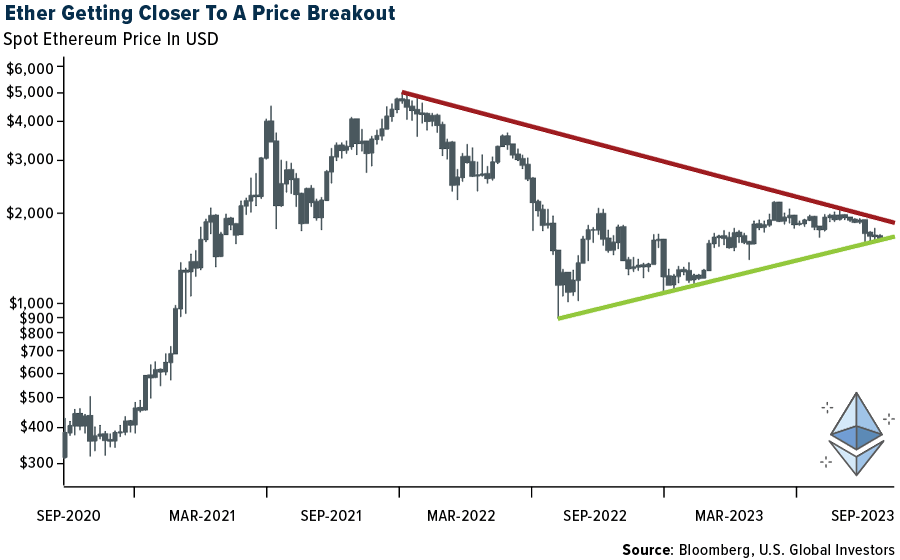
- Ether appears stuck inside a consolidation, delineated by two important trendlines – one drawn from the record highs seen in November 2021 and the other originating from the June lows last year. The latter has served as vital support all through the recovery and is being tested again, writes Bloomberg.
Weaknesses
- Of the cryptocurrencies tracked by CoinMarketCap, the worst performer for the week was Gala, down 14.83%.
- Several Binance executives have left in recent days, including leaders overseeing its Russian business and its connections to the traditional financial system, writes Bloomberg, extending a period of rapid senior turnover at the cryptocurrency giant.
- The U.S. Commodity Futures Trading Commission (CFTC) brought enforcement actions against three decentralized finance firms and signaled that more may be coming. The CFTC alleged on Thursday that three DEX’s broke the agency’s rules by illegally allowing U.S. customers to trade digital-asset derivatives without registering, according to Bloomberg.
Opportunities
- Riot Platforms, one of the largest Bitcoin miners in Texas, said it earned a record $31.7 million from power credits during the August heat wave. Bitcoin miners tend to pre-purchase power to lock in low prices for their energy intensive mining operations. They’ve made tens of millions of dollars by selling the power back to the grid during shortages that often take place during heat waves, writes Bloomberg.
- A group of cryptocurrency and Web3 venture investors have established a $20 million fund to invest in undervalued Web3 projects and companies focused on blockchain gaming and digital collectibles, reports Bloomberg.
- Pop star Justin Bieber’s hit song from 2015 “Company” has been converted into an NFT by music tech platform AnotherBlock, reports CoinMarketCap. This allows fans to earn royalties from future streams of the track.
Threats
- Former FTX executive Ryan Salame is planning to plead guilty to criminal charges on Thursday over the collapse of the cryptocurrency exchange. Salame was the co-chief executive of FTX Digital Markets before the crypto empire imploded and is scheduled to appear in Manhattan federal court on Thursday, writes Bloomberg.
- A crypto whale lost over $24 million worth of assets in a massive phishing scam. In this case the victim’s address is regarded as a major liquidity provider on the Uniswap DEX, supplying over $1.6 million worth of liquidity to the exchange’s WBTC/USDT pool, according to an article published by Bloomberg.
- The Estonian government has agreed to extradite Sergei Potapenko and Ivan Turogin to U.S. authorities over cryptocurrency fraud charges, writes Bloomberg.

Gold Market
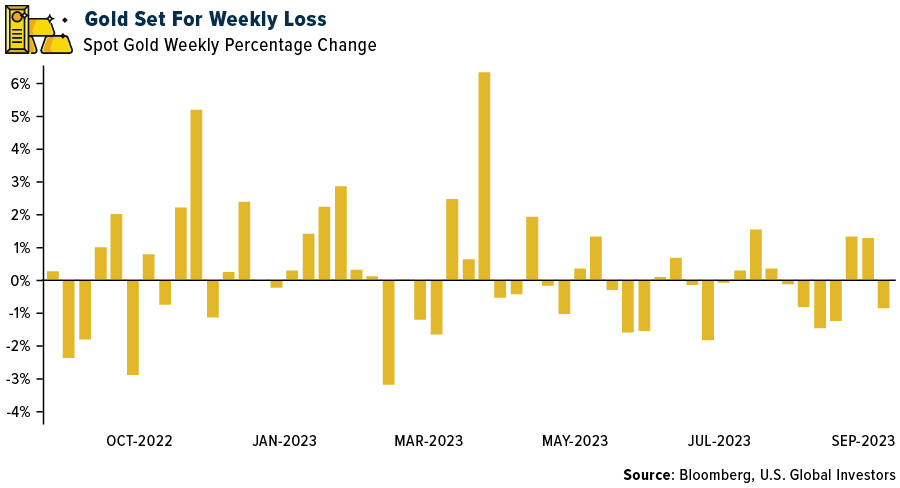
This week gold futures closed at $1,942.50, down $24.60 per ounce, or 1.25%. Gold stocks, as measured by the NYSE Arca Gold Miners Index, ended the week lower by 2.76%. The S&P/TSX Venture Index came in off 1.76%. The U.S. Trade-Weighted Dollar rose 0.79%.
Strengths
- Gold clocked a loss this week following two weeks of gains. The weakness was prompted by stronger economic data that drove the U.S. dollar and Treasury yields higher, with traders betting interest rates will remain high even if the Federal Reserve pauses its tightening cycle this month. Despite the dip, the People’s Bank of China released data showing an additional 930,000 troy ounces, or about 29 tons, to its reserves in August. This is the bank’s tenth consecutive monthly purchase as China and other countries diversify away from the U.S. dollar.
- According to Canaccord, Resolute Mining has reported a 47% increase in M&I Resources to 2.72Moz (previously 1.85Moz) and an 11% increase in total Resources to 3.53Moz (previously 3.18Moz), as a result of infill and down plunge extensions.
- Investor allocation to gold stands at its highest level in 11 years, according to an analysis by a JPMorgan strategist. Strategists led by Nikolaos Panigirtzoglou say the implied allocation to gold by non-bank investors has been led by central bank purchases.
Weaknesses
- The worst performing precious metal for the week platinum, down 7.44%, on news from the World Platinum Council that China holds more than 80% of global platinum inventories following two years of massive imports. Perhaps the imports were to secure supplies for their gasoline powered vehicles which still need platinum for pollution reduction. However, China’s EV adoption is at 17%, past the 5% adoption threshold for new car buying which typically signals the start of logarithmic adoption of EVs in a country. There could be an overhang in supply unless fuel cell production of hydrogen gains more traction in the future.
- According to RBC, Hochschild Mining’s first half 2023 EPS of -9/share was driven by an impairment charge of $60 million related to Azuca and Crespo projects ($42.3m), Aclara ($7.18m) and San Jose ($17.4m). The impairment at Azuca and Crespo was triggered by a revaluation of operating costs and capex.
- Spot palladium hit a 52-week low at $1,195.70 per troy ounce. Spot prices for palladium continue to be weak and have declined 33.3% year-to-date.
Opportunities
- According to Bank of America, with gold equities as a group having disappointed in 2023 year-to-date, the S&P Global Gold Index is down 5.3% year-to-date versus the gold price up 5.5%. Since many producers are pricing a gold price that is well below spot, while the royalty/streamers are pricing near spot, this suggests a rotation trade into the miners from the streamers might prove beneficial, particularly if gold gets a sustained lift. Scotia’s gold team recently recommended such a rotation trade too.
- Scottie Resources reported some of its first assays from the current 20,000-meter drilling program at the Blueberry Contact Zone. Encouraging results included 56.4 grams per ton (g/t) gold over 3.7 meters and 12.1 g/t gold over 3 meters. The Blueberry Contact Zone is 2km from Scottie’s 100% owned royalty free property which includes the past producing Scottie Gold Mine, 35 kilometers north of Stewart, BC, along the Granduc Road.
- Contrasting the value of hard assets versus financial assets, which have increasingly been driven by price momentum in technology stocks, a Bloomberg study shows that gold has outperformed stocks from the start to the end in each of the past three recessions. During the 2000 event, the ratio went from 0.15 to 0.17 over the period defined by NBER. During the global financial crisis, it nearly doubled from 0.34 to 0.62, and in the Covid recession, it climbed from 0.23 to 0.28. If an investor believes that recession is probable, adding some gold bullion or gold stocks might be a timely decision soon.
Threats
- China’s grip on platinum stockpiles is tightening, after it bought huge amounts and rebounding demand around the world whittled down global inventories.
Above-ground inventories of the metal will fall to about five months’ worth of demand by the end of 2023, according to the World Platinum Investment Council. But of that amount, more than four-fifths will be held in China, following two years of massive imports into the country that exceeded known consumption. - The latest data from the World Gold Council, covering the second quarter, shows a normalization in central bank purchases, though JPMorgan strategist Nikolaos Panigirtzoglou says that is likely due to turmoil in Turkey. “Going forward, it remains to be seen whether this normalization in central bank gold purchases in Q2 2023 is temporary, which, given the concentration in one country, could prove to be the case, or whether it becomes more persistent due to price sensitivity i.e., reluctance by central banks to buy more gold than their normal pace with gold prices at close to historical highs,” he says.
- Negotiations over wages with De Beers at its Venetia diamond mine in South Africa’s Limpopo province have collapsed and a dispute has been declared at the Commission for Conciliation, Mediation and Arbitration, the National Union of
Mineworkers said in an emailed statement.


U.S. Global Investors, Inc. is an investment adviser registered with the Securities and Exchange Commission (“SEC”). This does not mean that we are sponsored, recommended, or approved by the SEC, or that our abilities or qualifications in any respect have been passed upon by the SEC or any officer of the SEC.
This commentary should not be considered a solicitation or offering of any investment product. Certain materials in this commentary may contain dated information. The information provided was current at the time of publication. Some links above may be directed to third-party websites. U.S. Global Investors does not endorse all information supplied by these websites and is not responsible for their content. All opinions expressed and data provided are subject to change without notice. Some of these opinions may not be appropriate to every investor.
Holdings may change daily. Holdings are reported as of the most recent quarter-end. The following securities mentioned in the article were held by one or more accounts managed by U.S. Global Investors as of (06/30/2023):
*The above-mentioned indices are not total returns. These returns reflect simple appreciation only and do not reflect dividend reinvestment.
The Dow Jones Industrial Average is a price-weighted average of 30 blue chip stocks that are generally leaders in their industry. The S&P 500 Stock Index is a widely recognized capitalization-weighted index of 500 common stock prices in U.S. companies. The Nasdaq Composite Index is a capitalization-weighted index of all Nasdaq National Market and SmallCap stocks. The Russell 2000 Index® is a U.S. equity index measuring the performance of the 2,000 smallest companies in the Russell 3000®, a widely recognized small-cap index.
The Hang Seng Composite Index is a market capitalization-weighted index that comprises the top 200 companies listed on Stock Exchange of Hong Kong, based on average market cap for the 12 months. The Taiwan Stock Exchange Index is a capitalization-weighted index of all listed common shares traded on the Taiwan Stock Exchange. The Korea Stock Price Index is a capitalization-weighted index of all common shares and preferred shares on the Korean Stock Exchanges.
The Philadelphia Stock Exchange Gold and Silver Index (XAU) is a capitalization-weighted index that includes the leading companies involved in the mining of gold and silver. The U.S. Trade Weighted Dollar Index provides a general indication of the international value of the U.S. dollar. The S&P/TSX Canadian Gold Capped Sector Index is a modified capitalization-weighted index, whose equity weights are capped 25 percent and index constituents are derived from a subset stock pool of S&P/TSX Composite Index stocks. The NYSE Arca Gold Miners Index is a modified market capitalization weighted index comprised of publicly traded companies involved primarily in the mining for gold and silver. The S&P/TSX Venture Composite Index is a broad market indicator for the Canadian venture capital market. The index is market capitalization weighted and, at its inception, included 531 companies. A quarterly revision process is used to remove companies that comprise less than 0.05% of the weight of the index, and add companies whose weight, when included, will be greater than 0.05% of the index.
The S&P 500 Energy Index is a capitalization-weighted index that tracks the companies in the energy sector as a subset of the S&P 500. The S&P 500 Materials Index is a capitalization-weighted index that tracks the companies in the material sector as a subset of the S&P 500. The S&P 500 Financials Index is a capitalization-weighted index. The index was developed with a base level of 10 for the 1941-43 base period. The S&P 500 Industrials Index is a Materials Index is a capitalization-weighted index that tracks the companies in the industrial sector as a subset of the S&P 500. The S&P 500 Consumer Discretionary Index is a capitalization-weighted index that tracks the companies in the consumer discretionary sector as a subset of the S&P 500. The S&P 500 Information Technology Index is a capitalization-weighted index that tracks the companies in the information technology sector as a subset of the S&P 500. The S&P 500 Consumer Staples Index is a Materials Index is a capitalization-weighted index that tracks the companies in the consumer staples sector as a subset of the S&P 500. The S&P 500 Utilities Index is a capitalization-weighted index that tracks the companies in the utilities sector as a subset of the S&P 500. The S&P 500 Healthcare Index is a capitalization-weighted index that tracks the companies in the healthcare sector as a subset of the S&P 500. The S&P 500 Telecom Index is a Materials Index is a capitalization-weighted index that tracks the companies in the telecom sector as a subset of the S&P 500.
The Consumer Price Index (CPI) is one of the most widely recognized price measures for tracking the price of a market basket of goods and services purchased by individuals. The weights of components are based on consumer spending patterns. The Purchasing Manager’s Index is an indicator of the economic health of the manufacturing sector. The PMI index is based on five major indicators: new orders, inventory levels, production, supplier deliveries and the employment environment. Gross domestic product (GDP) is the monetary value of all the finished goods and services produced within a country’s borders in a specific time period, though GDP is usually calculated on an annual basis. It includes all private and public consumption, government outlays, investments and exports less imports that occur within a defined territory.
The S&P Global Luxury Index is comprised of 80 of the largest publicly traded companies engaged in the production or distribution of luxury goods or the provision of luxury services that meet specific investibility requirements.