
Sanctions Have a Spotty Record. Can They Stop Russia?
One of the very first recorded examples of a government imposing economic sanctions against another occurred as far back ago as the fifth century BC.
In brief, Athens blocked the city-state of Megara from gaining access to ports and harbors throughout its empire for a number of reasons, including Megarians’ desecration of land sacred to Demeter, the goddess of agriculture.
The blockades succeeded at cutting Megara off from nearly all trade, and its economy tanked as a result.
The sanctions worked so well, though, that they may have backfired on Athens. Many scholars and historians today believe that the Megarian Decree, as the sanctions are called, is at least partially to blame for the Peloponnesian War, a decades-long conflict between democratic Athens and oligarchic Sparta, Megara’s ally.
An important consequence of this war, I should add, is that it marked the end of Athens’ golden age. Upon its defeat, the once-great polis fell under the tyrannical control of Sparta. It never regained its former glory.
Fast forward 2,400 years, and Russia now finds itself the target of some of the toughest and most sweeping economic sanctions ever levied upon a country. Russian banks have been unplugged from SWIFT. The central bank’s foreign assets have been frozen. Yachts have been seized. Mastercard and Visa have blocked all transactions, and crypto exchanges are feeling the pressure to do the same.
Scores of private companies have suspended all operations within Russia. That includes nearly every major international automobile and aircraft manufacturer, from Volkswagen to Toyota to Ford and Boeing. Retailers and consumer tech companies have closed thousands of stores and halted shipments of goods, including Apple, Google, Samsung, Nike, Nestle and more.
I don’t believe the world has ever witnessed such a highly synchronized effort to ostracize a nation and isolate it from global markets. The steps have so far been deep and profound.
And yet will they be enough to stop President Putin? Put another way, how much economic pain is the world willing to bear as a result of the sanctions, when it’s likely uber-wealthy Putin will bear none of it?
The Least Worst Decision
The right answer, of course, is that the economic pain (i.e. inflation) is a very small, temporary price to pay if it means Ukraine has hope for survival. This week I attended an event hosted by the World Affairs Council of San Antonio, and I was hearted to see incredible support for the Ukrainian people.
Plus, sanctions have long been considered the least worst option, even when the results can be pretty unpleasant for everyone.
Arguably, no American president was as fond of using sanctions to exert influence on the world as Woodrow Wilson. He believed them to be an effective non-violent alternative to war, calling them a “peaceful, silent, deadly remedy… a terrible remedy.”
Although I don’t disagree with President Wilson’s characterization of sanctions, and although they’re far more preferable in most cases to launching an armed conflict, they haven’t always delivered. Athens’ sanctions backfired in the worst possible way, as we saw. Sanctions on Germany, Italy and Japan did little to nothing to prevent World War II.
By the 1990s, President Bill Clinton—who was no stranger to using sanctions himself—regretted that the U.S. had become “sanctions happy.”
And remember, in 2014, the U.S. levied sanctions against Russia for its 2014 annexation of Crimea. Nevertheless, hostilities have raged on in the region and in Eastern Ukraine.
Prepare for Even Hotter Inflation
Writing for the Atlantic Council, economist Hung Tan believes that Russia’s relatively small GDP—it contributes less than 2% to the world economy—means that any global economic pain should be temporary, “even though the fallout of the invasion will define geopolitics for years.”
At the same time, ours is very much a global economy. Russia, as many are aware, is a major supplier of oil and natural gas. It’s also believed to account for around 14% of the world’s metals and minerals, with a double-digit share in the production of palladium, diamonds, platinum and gold.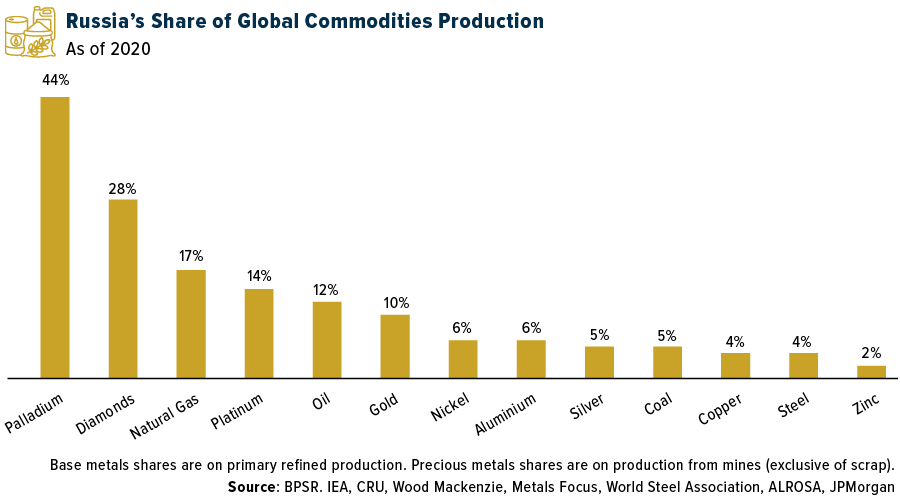
Indeed, the world was feeling the effects of higher energy prices even before Russia invaded Ukraine.
Brent crude oil, the global benchmark, briefly crossed above $120 per barrel this week for the first time since 2012.
Prices of key base metals have also surged on supply disruptions. The Bloomberg Industrial Metals Subindex had its best week on record, with aluminum, copper and nickel all hitting new record highs in London trading.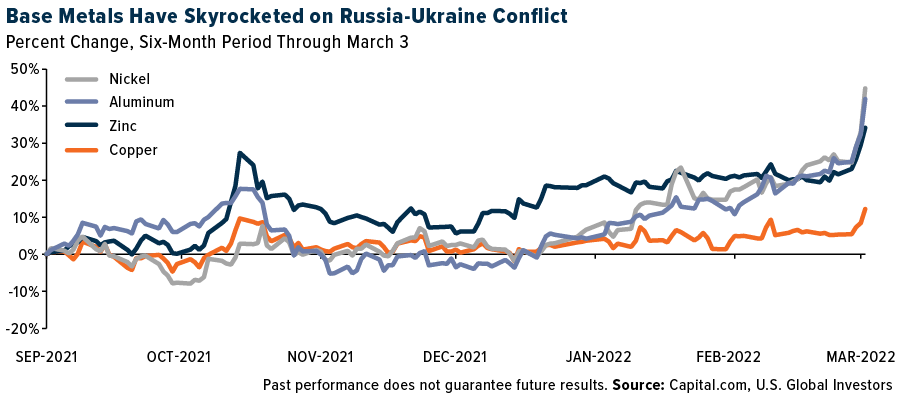
Bloomberg’s Mike McGlone points out that the price of West Texas Intermediate (WTI) crude, the U.S. benchmark, is following a similar trajectory last seen at the beginning of the global financial crisis.
This is notable because the Federal Reserve started easing in 2007 whereas it’s currently getting ready to raise rates, perhaps as soon as this month, to combat inflation; the move could “portend a lose-lose outcome for crude oil and equities,” McGlone writes.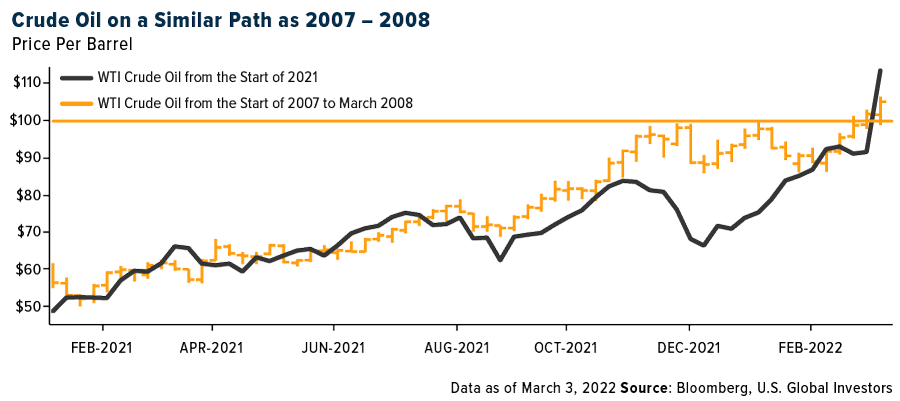
Banning Russian Oil
U.S. lawmakers now are calling for imports of Russian oil to be banned. The appetite appears to be bipartisan, and it’s not like the U.S. needs it. Oil brought in from Russia represents a relatively small share (ranging from around 5% to 9%) of the total amount of oil that the U.S. imports from all over the world.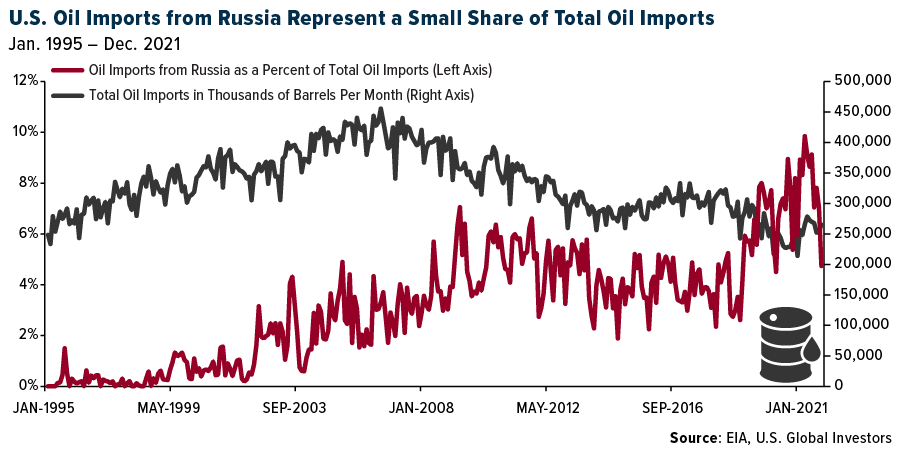
Despite former President Donald Trump’s claim that the U.S. is (or was) “energy independent,” it has imported an average of 277 million barrels of oil and petroleum products every month for the past five years. (The U.S. became a net exporter of refined petroleum in 2020, but the country still imports slightly more crude oil than it exports, as of last month. That could change this year, according to the U.S. Energy and Information Administration (EIA), as the U.S. continues to export a greater and greater amount of the stuff.)
In any case, I think a ban on Russian oil is likely, which could create even more pain at the pump in the short term.
Commodities and Gold
With supply disruptions almost certain to persist, exposure to a basket of commodities as well as gold seems prudent to me right now. This week gold hit $1,970 an ounce, its highest level since September 2020, and within throwing distance of its all-time high of $2,073.
As I told Kitco News’ David Lin, I believe gold is highly undervalued. Taking into account excessive money-printing and now geopolitical risk, the yellow metal could easily run up to $2,500 or $3,000.
Watch the interview by clicking here.
Index Summary
- The major market indices finished down this week. The Dow Jones Industrial Average lost 1.30%. The S&P 500 Stock Index fell 1.21%, while the Nasdaq Composite climbed 2.78%. The Russell 2000 small capitalization index lost 1.97% this week.
- The Hang Seng Composite fell 4.01% this week; while Taiwan was down 2.65% and the KOSPI dropped 8.87%.
- The 10-year Treasury bond yield fell 21 basis points to 1.747%.
Airline Sector
Strengths
- The best performing airline stock for the week was Air Transport Services, up 6.6%. System net sales improved for the seventh straight week to -31.2% versus 2019 for the week ending February 20 (versus last week at -38.5%). The improvement this week was primarily driven by better pricing, which reached its best level of the pandemic at -15.1% versus 2019 (versus -23.4% last week), while consolidated tickets sold was flat at -19.0% (versus -19.6% last week). After trailing domestic pricing for most of the pandemic (outside of a few weeks), international pricing caught up with domestic pricing this week (has trailed an average of nine points in 2022) with both down approximately -13% versus 2019 (versus domestic at -19.5% and international at -23.8% last week).
- European airline bookings showed another significant improvement in the week, the fourth consecutive weekly increase. Intra-Europe net sales were up by 17 points to -32% versus 2019 (versus -49% in the prior week) and increased by 34% this week. International net sales were broadly unchanged at -45% versus 2019, given a big step-up in the base but grew by 23% this week. This led to a 5-point increase in system-wide net sales for flights booked in Europe.
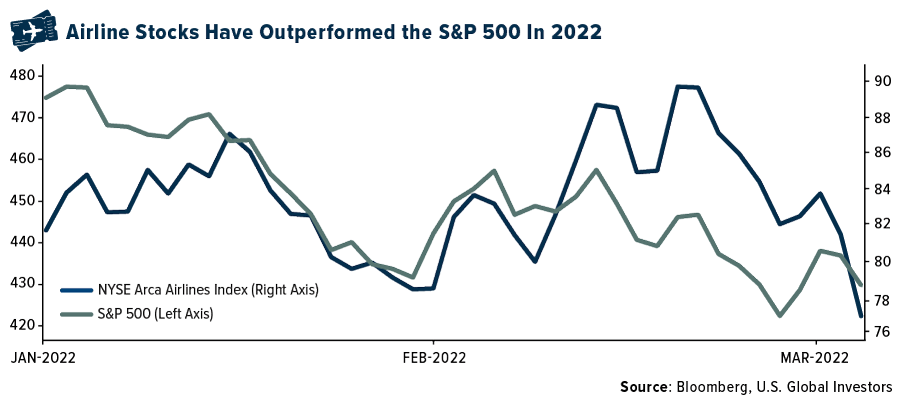
- Airline stocks outperformed again in February, up 1.4% this month compared to the S&P 500’s -3.1% decline. While the S&P 500 and other sectors have declined to start 2022, airline equities are slightly higher at 1.2% year-to-date and have outperformed the broader market an average of 4.8% in both months, despite the headwinds from recent geopolitical events.
Weaknesses
- The worst performing airline stock for the week was Finnair, down 28.1%. According to Bank of America, IAG expects a “significant operating loss” in the first quarter given the impact of Omicron on January/February bookings and additional ramp-up costs. The company lowered its 2022 estimated EBIT by 17%, due to higher staff and fuel costs. IAG plans to deploy 65% of 2019 capacity in the first quarter of 2022, below its previous estimate of 70%. The company expects a significant quarterly operating loss in the first quarter because of lower bookings, seasonality, and additional costs for rebuilding capacity.
- Delta Air Lines announced the suspension of its codeshare agreement with Russian national airline, Aeroflot, effective immediately. Following Russia’s invasion of Ukraine, Delta has removed its code from Aeroflot-operated services beyond Moscow’s Sheremetyevo Airport and removed Aeroflot’s code from Delta-operated services from Los Angeles and New York-JFK.
- British Prime Minister Boris Johnson announced that Aeroflot will be prohibited from flying within United Kingdom airspace or landing in the country. Similarly, some Baltic and European nations announced the closure of their airspace to Russian carriers as well. In response to these actions, Russia has closed its airspace to airlines from 36 countries, including Canada and all 27 members of the European Union, forcing airlines to find new routes.
Opportunities
- U.S. airlines’ trailing seven-day website visits stepped back up this week, up 13% versus 2019 (versus up 3% last week). Delta (-19% versus 2019) continues to trail its peers, United and American, which are both over 20% higher versus 2019 levels.
- TSA checkpoint data shows continued momentum since President’s Day weekend, indicating a faster-than-expected recovery in the space. On February 18, the Friday before the holiday weekend, TSA checkpoint numbers hit 2,241,123 (up 11% versus 2019) the highest checkpoint number since November 28, 2021 (the Sunday after Thanksgiving). It is also worth noting that this checkpoint number was higher than the Friday before President’s Day weekend in 2019.
- The latest forecast from the Forward Leading Indicator Traffic Estimate (FLITE) Index, which is Morgan Stanley’s proprietary short-term leading indicator of U.S. domestic air travel, predicts that RPKs in the month of February will recover faster than originally predicted. This is due to RPK data in December coming in better than the FLITE Index predicted one month ago.
Threats
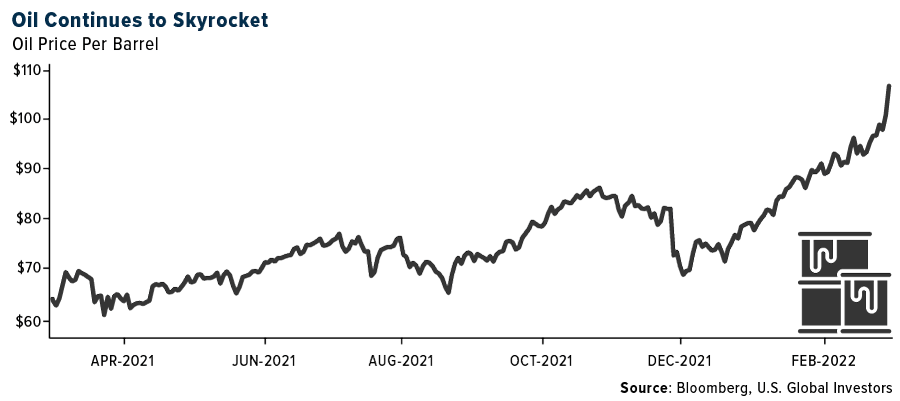
- Rising fuel prices might have an impact on some airlines, with jet fuel up 25% year-to-date, and Brent surpassing $100 per barrel. Fuel costs could be more challenging to pass on this year, given the potential for increased competition and excess capacity.
- According to Goldman Sachs, most of the airlines it covers do not hedge fuel. Historically, U.S. airlines have passed on higher fuel prices via fares rather than hedge.
- Ukraine closed its airspace to civilian aircraft as of Thursday morning. The U.K. banned aircraft owned or connected with Russia and suspended the foreign carrier permit of Russia’s Aeroflot, as mentioned in Weaknesses above.
Emerging Markets
Strengths
- The best relative performing country in emerging Europe for the week was Turkey, losing 1.60%. The best performing country in Asia this week was Malaysia, gaining 0.80%.
- The Turkish lira was the best relative performing currency in emerging Europe this week, losing 0.78%. The Malaysian ringgit was the best performing currency in Asia this week, gaining 0.53%.
- China released stronger-than-expected PMI data in February. The Manufacturing PMI came in at 50.2 versus the expected 49.8. China’s Service PMI was released at 51.6 versus the expected 50.7.
Weaknesses
- The worst performing country in emerging Europe for the week was Russia. The Moscow Stock Exchange was halted this week. However, the VanEck Russian ETF (RSX) was a good proxy for Russian stock market performance; RSX lost 63.7%. The worst performing country in Asia this week was India, losing 2.70%.
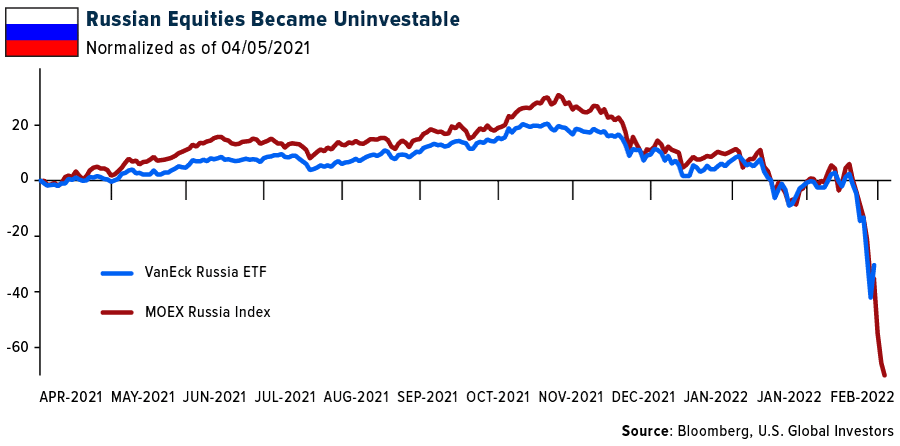
- The Russian ruble was the worst performing currency in emerging Europe this week, losing 28.13%. The Indian rupee was the worst performing currency in Asia this week, losing 1.95%.
- Global equity markets recorded large losses this week as war in Europe continues. The loss of human lives is the biggest tragedy, followed by destruction in Ukraine’s infrastructure. Financial markets are negatively impacted by this geopolitical event and volatility will remain high.
Opportunities
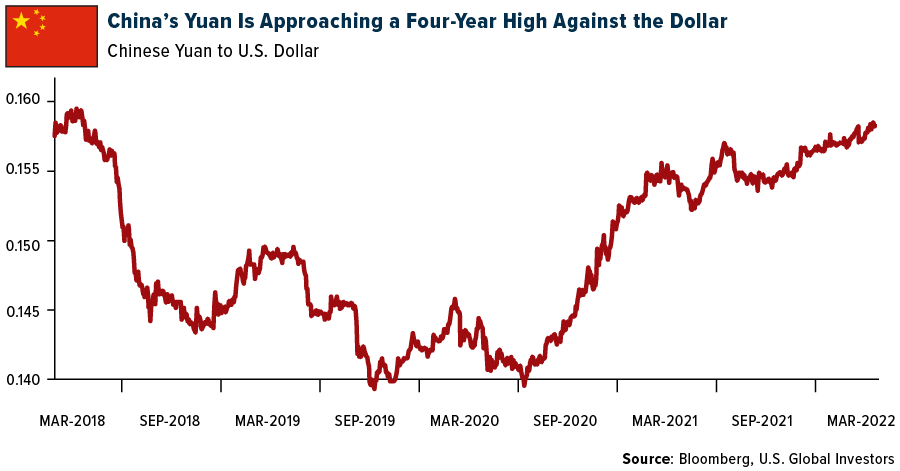
- The Chinese yuan is pushing into a four-year high and may continue to appreciate against the U.S. dollar. Russia has been taken out of the SWIFT messaging payment system and now more transactions could happen in renminbi. China has developed its own payment system (CIPS), processing only about 12,000 transactions per day versus 25 million for SWIFT, according to RenMacro.
- MSCI and FTSE have announced the removal of Russian securities from their indices. FTSE will make the change on March 4 and the MSCI will follow on March 9. The inflow of money into the alternative markets may be small now, considering the massive selloff in Russian GRDs and ADRs. Nevertheless, Poland may see the largest weight increase in the index.
- China expects high-risk banks to decrease by 2025. The People’s Bank of China (PBOC) said there were 316 high-risk financial institutions in the fourth quarter, comprising 1.04% of the country’s banks. This was a drop from 649 high-risk banks in the third quarter 2019 and the PBOC expects this number to fall below 200 by the year 2025. China is also expected to cut rates in March to ease financial conditions.
Threats
- The largest war in Europe since WWII has now lasted for more than a week. The Russian army has intensified attacks and is moving inward into Ukraine. This week Europe’s largest nuclear plant was captured. The second round of talks between Russia and Ukraine ended without a breakthrough. French President Macron spoke with Russian President Putin on Thursday, but a senior French official said it left Macron convinced the “worst is yet to come,” and Putin aims to take control of all of Ukraine, reports the Washington Post.
- European banks are the largest lenders to Russia, led by France ($32.6B) and Italy ($30.9B). The U.S. holds $25.3B in Russian debt, while Japan’s exposure totals $11.5B. Banks may have to prepare for potential write-offs and deteriorating credit ratings.
- This weekend China will hold a key meeting and is expected to set its gross domestic product between 5.0-5.5%. The consensus forecast is 5.1% and the IMF forecast is 4.8%. The GDP target will be below 6%, the first time since 1991.
Energy & Natural Resources
Strengths
- The best performing commodity for the week was wheat, May 22 future, up 40.62%, as wheat shipments from Ukraine, one of the world’s vital suppliers, are hindered by Russia’s invasion. Fertilizer prices are increasing. U.S. urea prices increased $100 per ton this week to $630 per ton, reflecting a combination of continued trade sanctions with Russia, the bounce in EU natural gas prices, and the near-term reopening of the Mississippi River, which has been closed for two months. DAP prices also jumped $100 per ton to $865 per ton.
- This year, the U.S. rig count has increased by 63 rigs. With Russia’s oil supply now at risk, a 50% increase in U.S. E&P capex is an increasingly likely outcome. This would imply another 100 rigs added through 2022, totaling 700 rigs.
- Oil extended a streak of extreme volatility, with Brent nearing $120 per barrel at one point on Thursday, as buyers continue to shun Russian crude following the invasion of Ukraine. The global benchmark was trading near $115 per barrel, after earlier adding as much as 6.1%. West Texas Intermediate touched its highest since 2008. There is also turmoil in markets for refined products, where prices are soaring.
Weaknesses
- The worst performing commodity for the week was coffee, May 22 future, down 6.03%, as Brazilian exporters are cancelling shipments contracts to Russia and Ukraine, citing securing payments as the issue, but many shippers are not taking bookings to the region. Global Polyethylene (PE) markets are bearish on the back of rising cost concerns in Europe and weak global demand. In Europe, the current geopolitical environment is causing volatility in the PE market. Supply chain challenges have been abating to some degree, but buyers fear further supply disruption from Russia if sanctions continue. Buyers also have concerns over increasing variable costs given the rise in crude oil and natural gas prices.
- China’s Purchasing Managers’ Index (PMI) for the domestic steel industry was 47.3 in February, down by 0.2 basis points last month, showing softening demand and supply in the market, according to the latest release by CFLP Steel Logistics Professional Committee (CSLPC). In February, “China’s steel production declined modestly, and domestic demand recovered at a slower pace, while the country’s steel prices first moved up and then fell,” CSLPC summarized.
- Steel prices fell again this week, although price declines for hot-rolled coil have slowed, now down $20 per ton to $1,000 per ton. While some mills were reported to be cutting deals as low as $900 per ton, others were said to be mulling price hikes. Cold-rolled and coated prices, which have lagged hot-rolled coil price trends in recent months, fell more sharply for a second week.
Opportunities
- Alcoa Corp.’s top executive is doubling down on his company’s vow to not add new aluminum capacity, writes Bloomberg, indicating the world shouldn’t rely on the largest U.S. aluminum producer to help ease supply pains. CEO Roy Harvey said Alcoa has no plans to add capacity or additional aluminum smelters. His comments are significant given aluminum’s surge to an all-time high on Monday, the article explains.
- BHP, which has been expanding its copper footprint in the past, will invest $79 million in Canadian junior Filo Mining, reports Mining.com. Filo is developing a copper-gold-silver project straddling the border between Argentina and Chile. Once the private placement is complete, which should happen on or before March 11, BHP will own about 5% of Filo Mining.
- According to Morgan Stanley, the events in Ukraine have introduced a risk premium in oil prices that is likely to remain in the coming months. Against a backdrop of market tightness, even small disruptions can have large price impacts. With that in mind, the group increased its second quarter Brent forecast to $110, with a bull case of $125 per barrel.
Threats
- High inventory levels and rail car shortages continue to impact plastic plant operations, with trade sources indicating several plants are either operating at reduced rates or have shut down altogether. Both buyers and sellers are finding it difficult to reduce their inventory levels as the end of the month nears, and to get rail cars returned, one producer was offering meaningfully discounted prices for HDPE film.
- Morgan Stanley’s coatings raw material index now calls for 1.6% deflation in 2022 versus 4.4% deflation two weeks ago, consistent with its expectations for a more gradual slope of descent for coatings raw materials. Relative to the mid-February index reading, the 3% increase in its 2022 index reading primarily reflects: 1) an upward revision to consultant propylene and polypropylene forecasts driven by higher crude oil prices amidst the Russia/Ukraine conflict; and, as a result: 2) higher acrylic acid prices.
- The European Commission will propose that member countries tax the profits energy companies made from recent gas price spikes and invest the revenue in renewable energy and energy-saving renovations, sources familiar with the matter said on Monday. The proposal, which could change before it is published, would not introduce an EU-wide tax. Rather, it would tell governments that they can introduce such levies on a national level without falling foul of EU rules.
Domestic Economy & Equities
Strengths
- February headline nonfarm payrolls of 678,000 was reported ahead of the 400,000 consensuses. Private payrolls of 654,000 also came in well above the 340,000 consensuses. The unemployment rate dropped 0.2% to 3.8%, beating consensus of 3.9%.
- Initial jobless claims for the week fell 18,000 week-over-week to 215,000, beating estimates for 230,000. Continuing claims of 1,476,000 were unchanged week-over-week but missed estimates for a lower reading of 1,435,000.
- Occidental Petroleum, an oil exploration and production company, was the best performing S&P 500 stock for the week, increasing 44.36%. Shares soared with the spike in oil price, gaining more than 25% in a week on supply concerns after Russia invaded Ukraine.
Weaknesses
- February’s ISM Non-Manufacturing Index fell 3.4 points month-over-month to 56.5, missing estimates for 61.0 and the lowest print since February 2021. Supply chain challenges have impacted the ability of businesses to meet demand, leading to cooling in business activity and economic growth.
- Final February Markit U.S. Manufacturing PMI was released at 57.3 versus the expected 57.5, unchanged from the preliminary print.
- Epam Systems Inc. (EPAM), an information technology company, for the second week in a row closed as the worst performing S&P 500 stock, losing 48.04%. The company announced that it will be negatively impacted by Russia’s invasion of Ukraine. EPAM has about 14,000 personnel in Russia, including 13,000 delivery workers.
Opportunities
- The job market could continue to improve with jobless claims and continuous claims declining further. Bloomberg economists also predict job openings to increase to 10,968,000 in January from 10,925,000 in December. JOLTS job opening data will come out March 9 and the jobless claims and continuous claims will be announced on March 10.
- The NFIB Small Business Optimism Index will be released next week, on March 8. Most Bloomberg economists predict a higher reading, expecting 97.4 in February versus 97.1 in January.
- According to FactSet’s Earnings Scorecard, just over 99% of S&P 500 companies have reported fourth quarter results. The blended growth rate now stands at 31.5%, up just over 10% from the 21.4% expected at the end of the quarter. Just over 76% of companies have beaten consensus earnings per share expectations, below the 83% one-year average, but in-line with the five-year average. Companies continue to navigate headwinds from persistent supply chain disruptions, FactSet commented.
Threats
- Ukraine said it did not get the result it hoped for in the second round of talks with Russia but agreed to hold another round of talks. It also agreed on a humanitarian and disaster relief mechanism that could feature a temporary ceasefire. French President Macron said after a call with Putin on Friday that “the worst is yet to come.”
- The war in Europe, spiking commodity prices and supply concerns, will push inflation higher this year. According to predictions from the United Kingdom this week, war will add 3% to global inflation this year. The Federal Reserve may have to hike rates more and faster than expected.
- Major U.S. equity indices finished lower this week, but sector performance was mixed. Geopolitical uncertainty may continue to put pressure on equites.
Blockchain and Digital Currencies
Strengths
- Of the cryptocurrencies tracked by CoinMarketCap, the best performer for the week was Star Wars Cat, rising 3,637%.
- Bitcoin surged as much as 10% on Monday, rebounding from a weekend selloff amid speculation that cryptocurrencies will gain favor in the wake of sanctions against Russia, writes Bloomberg.
- Bitcoin’s strength is being driven by Russians choosing the cryptocurrency as an avenue to move their wealth out of the country, legendary investor Mark Mobius says. Mobius commented that this is the avenue to get money out of Russia, in an interview with CNBC on Tuesday.
Weaknesses
- Of the cryptocurrencies tracked by CoinMarketCap, the worst performing for the week was Spook Inu, down 99.99%.
- Ukraine has scrapped a plan to reward people who donated to its fight against a Russian invasion with newly created crypto assets, writes Bloomberg, following complications with the project. Ukraine’s Vice Prime Minister Mykhailo Federov said in a tweet that the nation decided to drop the so called “airdrop” and instead would soon announce NFTs to support Ukrainian Armed forces soon.
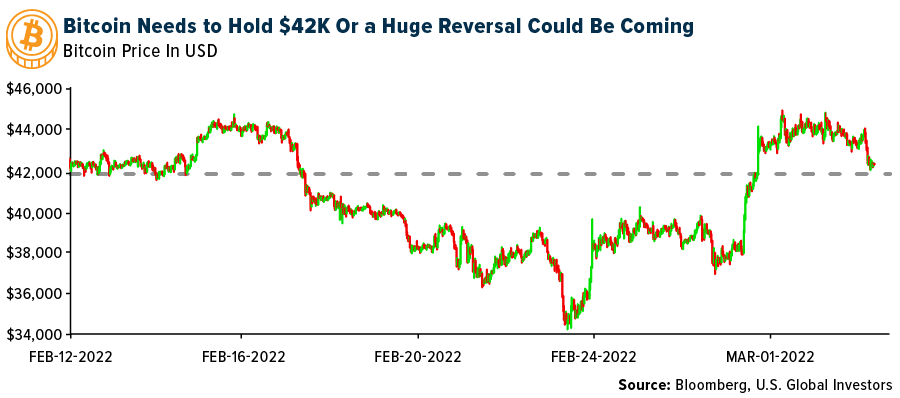
- Bitcoin is finding a lot of selling pressure above the $44,000 level. The popular digital currency needs to at least hold near $42,000 or it could face the fear of retracing dramatically to under $40,000 per coin (and potentially stay under the $40,000 level for a while).
Opportunities
- Crypto hedge fund Pantera Capital has backed African crypto exchange VALR.com in its latest funding round, reports Bloomberg, valuing the company at $240 million, the U.S group’s first foray into the continent. Crypto has started to boom in Africa and the exchange started its operations in 2019, facilitating $7.5 billion worth of annual trades in more than 60 digital currencies, the article continues.
- CME group plans to launch cryptocurrency options on micro-Bitcoin and Ether futures March 28, subject to regulatory review. The new options contracts will be one-tenth of its respective underlying tokens in size and have monthly or weekly expires according to CME and reported by Bloomberg.
- Fast-food chain Wingstop has filed a multi-class trademark to sell chicken wings in the metaverse. The application covers “downloadable virtual goods” including NFTs and virtual food and drinks, writes Bloomberg.
Threats
- The Biden administration is asking crypto exchanges to help ensure that Russian individuals and organizations aren’t using virtual currencies to avoid sanctions. The White House’s National Security Council and the Treasury Department have sought help from operators of some of the world’s largest trading platforms to thwart any attempts to sidestep the stiff restrictions levied by the U.S and its allies, writes Bloomberg.
- In his senate hearing this week Federal Reserve Chairman Jerome Powell let the Finance Banking Committee know that the Fed will do whatever it takes to get inflation down. Bitcoin was off about 3.75% during his hearing as the inflation hedge risk asset digested his hawkish tone.
- Hundreds of NFTs were stolen in the TreasureDAO exploit, conducted through a series of transactions, according to crypto potato. The attackers were able to exploit a bug in the protocol that enabled them to mint NFTs for free. Soon after the platform urged its users to de-list their NFTs from the marketplace.
Gold Market
This week April 22 gold futures was approaching the close at $1,971.50, up $83.90 per ounce, or 4.44%. Gold stocks, as measured by the NYSE Arca Gold Miners Index, ended the week higher by 8.36%. The S&P/TSX Venture Index came in up just 1.32% as investor money still focused at the top of the food chain. The U.S. Trade-Weighted Dollar soared up 2.03% for the week.
| Date | Event | Survey | Actual– | Prior |
|---|---|---|---|---|
| Feb-28 | Caixin China PMI Mfg | 49.1 | 50.4 | 49.1 |
| Mar-1 | Germany CPI YoY | 5.1% | 5.1% | 4.9 |
| Mar-1 | ISM Manufacturing | 58.0 | 58.6 | 57.6 |
| Mar-2 | Eurozone CPI Core YoY | 2.6% | 2.7% | 2.3% |
| Mar-2 | ADP Employment Change | 375k | 475k | 509 |
| Mar-3 | Initial Jobless Claims | 225k | 215k | 233k |
| Mar-3 | Durable Goods Orders | 1.6% | 1.6% | 1.6% |
| Mar-4 | Change In Nonfarm Payrolls | 423k | 678k | 481k |
| Mar-10 | ECB Main Refinancing Rate | 0.000% | — | 0.000% |
| Mar-10 | CPI YoY | 7.9% | — | 7.5% |
| Mar-10 | Initial Jobless Claims | 220k | — | 215k |
| Mar-11 | Germany CPI YoY | 5.1% | — | 5.1% |
Strengths
- The best performing precious metal for the week was palladium, up 26.18% on the June 22 future contract, as Russia’s invasion of Ukraine raises concern on disruption of world supplies. The Bank of Russia said it will start purchasing gold again, just under two years after it ended a long-running buying spree that helped prop up bullion prices last decade. The central bank will begin buying gold again on the domestic precious metals market, it said in a statement. The move comes after the monetary authority and several of the country’s commercial banks were sanctioned in response to Russia’s invasion of Ukraine. The Bank of Russia spent six years rapidly accumulating gold, doubling its holdings and becoming the biggest sovereign buyer.
- Gold headed for its biggest weekly gain since May, lifted by demand for haven assets as Russia escalated the conflict in Ukraine. Prices for the precious metal climbed amid falling Treasury yields, after earlier spiking on news that Russia had attacked Europe’s largest nuclear power plant. Investors are weighing the economic fallout from Russia’s invasion of its neighbor, which is disrupting flows of energy, grains and metals. The resulting surge in oil prices has stoked concerns about global growth and inflation risks.

- Gold has historically performed well in times of not only higher inflation but also rising rates, according to the World Gold Council (WGC). For the past four Federal Reserve tightening cycles, between February 1994 and December 2015, the yellow metal underperformed in the months leading up to the Fed’s first-rate hike but then outperformed U.S. stocks and the dollar six months and one year following liftoff.
Weaknesses
- The worst performing precious metal for the week was gold, but still up 4.52% on the April 22 future going into the closing hour of trading. Russian supply disruption on commodities will create operational bottlenecks. Russia represents 40% of global palladium mine supply, 30% of diamonds, 15% of rhodium and platinum, 15% of global aluminum supply, 6-8% of nickel, 5% of copper, 10% of gold and 17% of natural gas.
- Impala Platinum reported disappointing first half 2022 results with cash generation missing consensus by R9.0 billion. The miss was driven by a 20% worse than consensus EBITDA of R24.0 billion. The poor EBITDA performance was due to a combination of worse than consensus margin contraction and lower than expected sales volumes with stock adjusted group unit costs increasing 17.2% year-over-year to R16,756 per ounce. As a result, headline earnings per share (EPS) of ZAR16.90, was 22% worse than consensus.
- FTSE 100 gold producer Polymetal lost half its market value on Monday as the west ramped up sanctions on Russia over its attack on Ukraine and one of its biggest shareholders prepared to sell. Shares in the London-listed company, which operates eight mines and a state-of-the-art processing plant in Russia and Kazakhstan, dropped 56% to 351.2p, its lowest level since listing in London more than a decade ago. Norway’s sovereign wealth fund, one of Polymetal’s top 10 shareholders, said it will dump all its Russian investments as part of a wider package of support for Ukraine.
Opportunities
- Perseus Mining announced it intends to buy Orca Gold, which owns 31.5% of Montage Gold. Montage is led by former executives of Red Back Mining that owned the Tasiast and Chirano gold mines in Mauritania and Ghana, respectively, before being acquired by Kinross Gold for $7 billion in 2010. Key members then founded Orca Gold. Earlier this month Montage announced results of the feasibility study on the Kone Gold Project in Cote d’Ivoire.
- Sibanye Stillwater Ltd. expects palladium prices to moderate as the market gets more clarity on the reality of Russian supply disruptions following the invasion of Ukraine. Palladium surged about 45% this year. Russia produces almost two-fifths of the world’s supply, which is mainly used in devices that curb pollution in gasoline-powered cars.
- According to JPMorgan, gold’s year-to-date decoupling with real yields as well as a continued elevated level of Russian risk premium in the coming quarters, means a substantial premium should be sustained much longer, blunting gold’s fall amidst forecasted higher rates. Consequently, last week the group boosted its second-quarter gold price forecast by 12% to $1,850 per ounce and increased its full-year 2022 average by 11% to $1,808 per ounce.
Threats
- Kinross has elected to suspend operations at its Russian assets as a result of the ongoing invasion of Ukraine by Russia, and it’s in the process of ramping down mining operations at Kupol and all activities at its Udinsk development project, which this year included work to complete feasibility study in the third quarter. Kupol was expected to contribute 350,000 ounces of production in 2022 (13% of total anticipated production), which represents approximately $200M in cash flow.
- Russia-focused miner Polymetal suspended its costs guidance for 2022, as the war in Ukraine and the resulting sanctions spreads uncertainty for miners. “We are shocked and appalled by the events going on in Ukraine,” Polymetal chief executive Vitaly Nesis said. Polymetal maintained its production guidance, and said operations were not likely to be affected, but warned of the economic uncertainty spread by the conflict. “The current devastating conflict in Ukraine and related economic and political developments are likely to require a lot of management efforts to maintain Company performance,” Polymetal said.
- Gold ETF holdings currently sit at 100 million ounces, unchanged from one month ago but down from all-time highs of 111 million ounces back in the fall of 2020. Net investor positioning has increased to 28 million ounces from 25 million ounces one month ago but is still down from a high of 39 million ounces back in February 2020.
U.S. Global Investors, Inc. is an investment adviser registered with the Securities and Exchange Commission (“SEC”). This does not mean that we are sponsored, recommended, or approved by the SEC, or that our abilities or qualifications in any respect have been passed upon by the SEC or any officer of the SEC.
This commentary should not be considered a solicitation or offering of any investment product. Certain materials in this commentary may contain dated information. The information provided was current at the time of publication. Some links above may be directed to third-party websites. U.S. Global Investors does not endorse all information supplied by these websites and is not responsible for their content. All opinions expressed and data provided are subject to change without notice. Some of these opinions may not be appropriate to every investor.
Holdings may change daily. Holdings are reported as of the most recent quarter-end. The following securities mentioned in the article were held by one or more accounts managed by U.S. Global Investors as of (12/31/2021):
Delta Air Lines
United Airlines
American Airlines
Alcoa Corp
Filo Mining
Volkswagen AG
The Boeing Co.
Apple Inc.
Impala Platinum Holdings Ltd.
Perseus Mining Ltd.
Orca Gold Inc.
Montage Gold Corp.
Sibanye Stillwater Ltd.
Occidental Petroleum
*The above-mentioned indices are not total returns. These returns reflect simple appreciation only and do not reflect dividend reinvestment.
The Dow Jones Industrial Average is a price-weighted average of 30 blue chip stocks that are generally leaders in their industry. The S&P 500 Stock Index is a widely recognized capitalization-weighted index of 500 common stock prices in U.S. companies. The Nasdaq Composite Index is a capitalization-weighted index of all Nasdaq National Market and SmallCap stocks. The Russell 2000 Index® is a U.S. equity index measuring the performance of the 2,000 smallest companies in the Russell 3000®, a widely recognized small-cap index.
The Hang Seng Composite Index is a market capitalization-weighted index that comprises the top 200 companies listed on Stock Exchange of Hong Kong, based on average market cap for the 12 months. The Taiwan Stock Exchange Index is a capitalization-weighted index of all listed common shares traded on the Taiwan Stock Exchange. The Korea Stock Price Index is a capitalization-weighted index of all common shares and preferred shares on the Korean Stock Exchanges.
The Philadelphia Stock Exchange Gold and Silver Index (XAU) is a capitalization-weighted index that includes the leading companies involved in the mining of gold and silver. The U.S. Trade Weighted Dollar Index provides a general indication of the international value of the U.S. dollar. The S&P/TSX Canadian Gold Capped Sector Index is a modified capitalization-weighted index, whose equity weights are capped 25 percent and index constituents are derived from a subset stock pool of S&P/TSX Composite Index stocks. The NYSE Arca Gold Miners Index is a modified market capitalization weighted index comprised of publicly traded companies involved primarily in the mining for gold and silver. The S&P/TSX Venture Composite Index is a broad market indicator for the Canadian venture capital market. The index is market capitalization weighted and, at its inception, included 531 companies. A quarterly revision process is used to remove companies that comprise less than 0.05% of the weight of the index, and add companies whose weight, when included, will be greater than 0.05% of the index.
The S&P 500 Energy Index is a capitalization-weighted index that tracks the companies in the energy sector as a subset of the S&P 500. The S&P 500 Materials Index is a capitalization-weighted index that tracks the companies in the material sector as a subset of the S&P 500. The S&P 500 Financials Index is a capitalization-weighted index. The index was developed with a base level of 10 for the 1941-43 base period. The S&P 500 Industrials Index is a Materials Index is a capitalization-weighted index that tracks the companies in the industrial sector as a subset of the S&P 500. The S&P 500 Consumer Discretionary Index is a capitalization-weighted index that tracks the companies in the consumer discretionary sector as a subset of the S&P 500. The S&P 500 Information Technology Index is a capitalization-weighted index that tracks the companies in the information technology sector as a subset of the S&P 500. The S&P 500 Consumer Staples Index is a Materials Index is a capitalization-weighted index that tracks the companies in the consumer staples sector as a subset of the S&P 500. The S&P 500 Utilities Index is a capitalization-weighted index that tracks the companies in the utilities sector as a subset of the S&P 500. The S&P 500 Healthcare Index is a capitalization-weighted index that tracks the companies in the healthcare sector as a subset of the S&P 500. The S&P 500 Telecom Index is a Materials Index is a capitalization-weighted index that tracks the companies in the telecom sector as a subset of the S&P 500.
The Consumer Price Index (CPI) is one of the most widely recognized price measures for tracking the price of a market basket of goods and services purchased by individuals. The weights of components are based on consumer spending patterns. The Purchasing Manager’s Index is an indicator of the economic health of the manufacturing sector. The PMI index is based on five major indicators: new orders, inventory levels, production, supplier deliveries and the employment environment. Gross domestic product (GDP) is the monetary value of all the finished goods and services produced within a country’s borders in a specific time period, though GDP is usually calculated on an annual basis. It includes all private and public consumption, government outlays, investments and exports less imports that occur within a defined territory.
The Financial Times Stock Exchange 100 Index, also called the FTSE 100 Index, FTSE 100, FTSE, or, informally, the “Footsie”, is a share index of the 100 companies listed on the London Stock Exchange with the highest market capitalization.
The MSCI World Index is a broad global equity index that represents large and mid-cap equity performance across all 23 developed markets countries. It covers approximately 85% of the free float-adjusted market capitalization in each country.
The Bloomberg Industrial Metals Indexed is a subindex of the Bloomberg Commodity Index.
The Job Openings and Labor Turnover Survey (JOLTS) program produces data on job openings, hires, and separations.
The National Federation of Independent Business (NFIB) Small Business Optimism Index is a composite of ten seasonally adjusted components.


