
Nowhere to Run, Nowhere to Hide
Martha and the Vandellas’ “Nowhere to Run” was one of the hottest singles of 1965, but the classic Motown hit may as well be the official soundtrack of investing in 2022. Not only did the S&P 500 post its worst first-half of the year in over 50 years and fall further into bear territory, but nearly every other asset class—the glaring exception being fossil fuels—turned in a negative performance.
In the chart below are several indices of industries and sectors we closely track here at U.S. Global Investors. Every single one of them ended in the red.
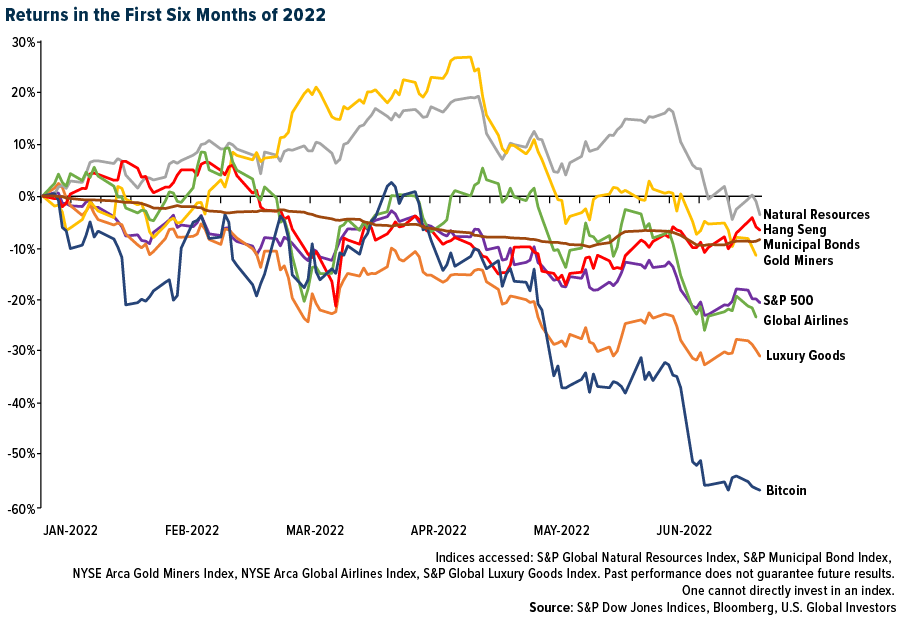
Even traditional safe havens offered little protection. Bonds have historically shined when stocks have plunged, but Treasuries and municipals sold off in the first six months. Gold was essentially flat, having shed a little over 1%; meanwhile, gold miners were among the biggest winners of the first quarter but subsequently traded sharply down as soaring fuel costs kneecapped revenues.
Some people have argued that Bitcoin could replace gold as a store of value, but the digital asset just finished its worst month on record. The crypto lost more than 38% of its value in June alone, and for all of 2022 so far, it’s down about 57%.
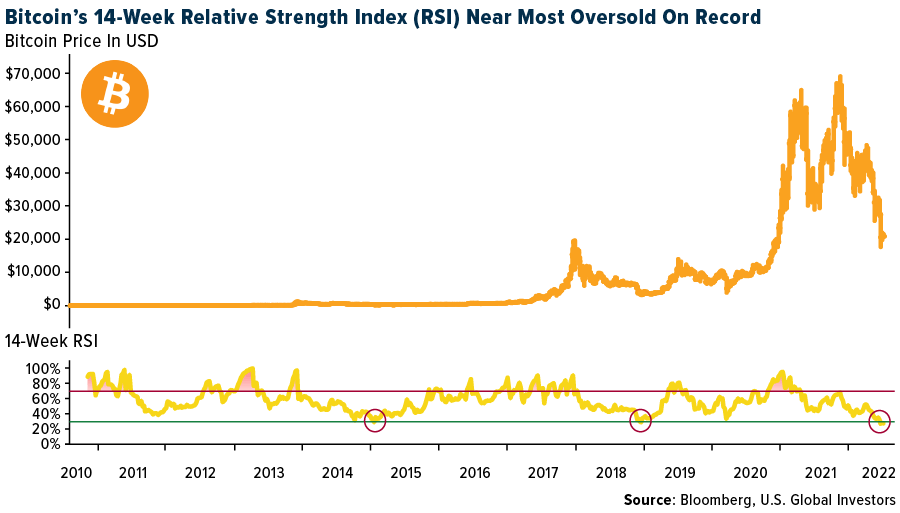
If you’re a contrarian, this may be an interesting buying opportunity. Bitcoin’s 14-week relative strength index (RSI) is now in line with its most oversold levels on record, in early 2015 and late 2018. During both of these “crypto winters,” critics of digital assets gleefully proclaimed the end to Bitcoin, and many are doing so today. I’ll just say that, had you accumulated Bitcoin when the RSI was this low, you would have seen some incredible returns. (Past performance is no guarantee of future results.)
A “Perfect Storm” of Factors
So how did we get here? Current markets conditions were largely triggered by a perfect storm of rising interest rates, sky-high inflation, record fuel costs and the end of easy money. Put another way, Powell & Co. stomped on the brakes just as the economy appeared to be slowing down.
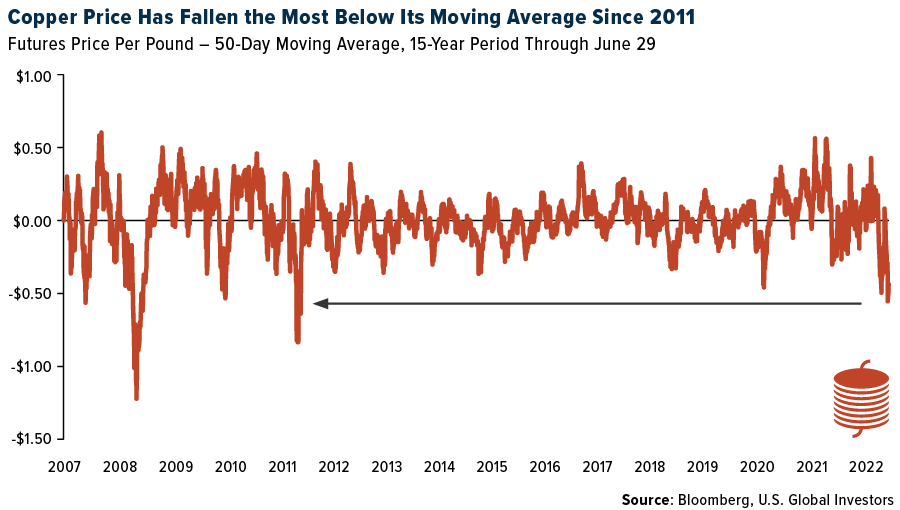
Copper is often called “Doctor Copper” since its price action has predicted economic upswings and downturns with a relatively high level of accuracy. This year, the red metal, which is found in nearly everything, has fallen the most below its 50-day moving average since 2011, when copper lost a third of its value.
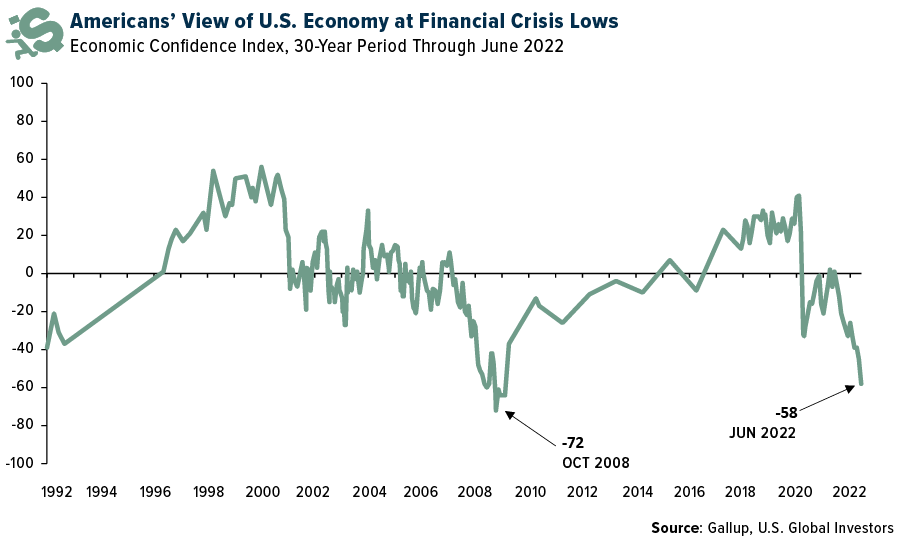
You don’t need to follow the copper market, of course, to know that conditions may be worsening. According to a just-released Gallup poll, Americans’ view of the economy in June fell to its lowest level since the financial crisis.
The U.S. economy may already be in recession, which occurs when gross domestic product (GDP) contracts for two consecutive quarters. Real GDP fell at an annual rate of 1.6% in the first quarter, and the Atlanta Fed is now projecting a second-quarter decrease of 1.0%.
On top of everything else, this is a midterm election year for a first-term president (whose approval rating, I should point out, is slipping). Historically, this has resulted in an extra shot of market volatility as the mudslinging between the two parties intensifies. Since 1946, the second year of a new Democratic president has ended in an S&P 500 loss of 2.3% on average, according to Jeff Hirsch, editor-in-chief of The Stock Trader’s Almanac.
Outlook for the Remainder of 2022
Investors are now left wondering where they can hide for the remainder of 2022. As I said in an earlier post, gold has been one of the very few bright spots this year. It’s managed to stay essentially flat even as the value of the U.S. dollar has surged, which is more than we can say about nearly everything else. I expect it to perform just as well, if not better, in the second half.
No doubt about it, this has been a very challenging market environment to navigate, and we look to be in for more of the same. The Fed will continue to tighten monetary policy, and the longer the conflict in Ukraine persists, the longer we’ll likely feel the pressure from elevated gas prices. A “war tax,” if you will.
Everything is extremely oversold, and investors may be tempted to start speculating. No one can say what will happen next, but keep in mind that we may not have found the bottom. I would be extra cautious before making any big bets.
Watch our latest video, “How Gen Z Will Change the Future of Investing,” by clicking here!

Index Summary
- The major market indices finished down this week. The Dow Jones Industrial Average lost 1.28%. The S&P 500 Stock Index fell 2.21%, while the Nasdaq Composite fell 4.13%. The Russell 2000 small capitalization index lost 2.15% this week.
- The Hang Seng Composite gained 0.65% this week; while Taiwan was down 21.27% and the KOSPI fell 22.57%.
- The 10-year Treasury bond yield fell 25 basis points to 2.88%.
Airline Sector
Strengths
- The best performing airline stock for the week was Air China, up 16.6%. China domestic demand was down 53.4% year-over-year in June, a great improvement from being down 76.6% year-over-year in May. Domestic load factors also improved to 67% in June (from 62% in May).
- United Airlines has concluded the wage negotiation with its pilot union. The ratification vote is scheduled to close on July 15. The negotiation includes an average wage rate increase of 15% by January 2024.
- JetBlue Airways again increased its offer for Spirit Airlines this week, reports Reuters, with a shareholder vote for the discounter’s deal to merge with Frontier Airlines just days away. JetBlue’s new offer raises the reverse break-up fee to $400 million from $350 million if regulators don’t approve the deal, the article continues. It includes a dividend to Spirit shareholders of $2.50 per share, up from a previous offer of $1.50.
Weaknesses
- The worst performing airline stock for the week was Bombardier, down 16.4%. Cathay Pacific hosted a business update call this week, providing an overall balanced view with key messages including: 1) the first half of 2022 is expected to slip back to loss-making, although the loss is likely narrower on a year-over-year basis, 2) monthly cash burn remains at <HK$0.5 billion, likely to continue for a few months, 3) capacity reinstatement is underway, but at a very slow pace, while the future path depends on Hong Kong’s crew quarantine policy, and 4) the air cargo business is seeing fiercer competition, with peers aggressively adding capacity amid broader reopening.
- Ryanair’s cabin crew went on strike this week in Belgium, Spain, and Portugal, over pay and working conditions, with the strikes due to last most of the weekend. The cabin crew in France and Italy are also expected to strike over the weekend. Ryanair has already negotiated labor agreements covering over 90% of staff across Europe, with the cabin crew due to strike a small proportion of the total.
- U.S. consumers logged more than quadruple the number of complaints against U.S. airlines in April compared with pre-pandemic levels, as on-time arrivals fell, according to an industry report. Around 32% of complaints concerned refunds and 31% involved flight delays and other problems. In April 2022, major carriers posted an on-time arrival rate of 76%, down from 77.2% in March and below the 79.8% rate in April 2019, the report explained.
Opportunities
- China has reduced its quarantine times for inbound travelers by half, reports Bloomberg. Travelers will now only spend seven days in a quarantine facility, instead of the previous three weeks. The change still leaves the Asian nation an outlier in a world that has mostly adjusted to living with the virus, the article continues, but nevertheless markets cheered the move.
- According to JPMorgan, airline stocks, as measured by the NYSE Arca Airline Index, have retreated 37% from their six-month highs, closing in on the typical 40% correction that has preceded most U.S. recessions. However, this potential economic slowdown could prove anything but typical. In fact, the bank believes the industry is better prepared than usual, owing that to tight capacity, record liquidity, and still-improving corporate and international demand trends. These facts only strengthen their conviction that risk/reward is approaching a point difficult to ignore.
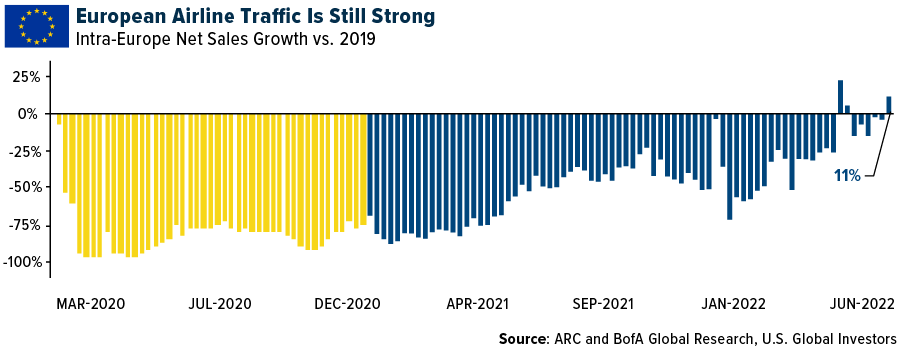
- Intra-Europe net sales increased by 15 points this week to up 11% versus 2019 levels and grew by 7% week-on-week. International net sales were up by six points to -1% versus 2019 and increased by 7% week-on-week. This led to a nine-point improvement in system-wide net sales to up 2% versus 2019, the first time it has exceeded 2019 levels.
Threats
- Qantas Airways has provided a trading update, stating that travel demand remains strong, but the airline will further reduce capacity from July in order to “help the group substantially recover the elevated cost of fuel.” This will see domestic capacity reduced to 99%/106% of pre-Covid levels in the first quarter of 2023/the second quarter of 2023, respectively. There are no changes to Qantas’ international capacity plans, which are expected to steadily increase from 50% of pre-Covid levels currently to around 70% by the end of the first quarter of 2023.
- For the week, U.S. airline industry web traffic was 24% higher year-over-year versus a 44% increase last week. Among Latin American carriers, web traffic is up 20% year-over-year versus up 31% year-over-year last week. Although the increases are milder than last week’s, improvement is still present. European carrier web traffic is up 75% year-over-year versus up 96% year-over-year last week.
- According to a Morgan Stanley survey, for the past two weeks, travel spend intentions over the next six months down ticked across nearly every income bracket. The survey shows 53% of total respondents planning to travel over the next six months, which is down from 58% at the end of May. The percentage of high-income consumers planning to cut back on travel due to inflation also increased 8 percentage points (58% versus 50% in May). Tourism/vacation, the most discretionary form of travel, and a leading indicator, saw the biggest month-over-month decline in respondents’ reasons for travel over the next six months.
Emerging Markets
Strengths
- The best performing country in emerging Europe for the week was Poland, gaining 0.8%. The best performing country in Asia this week was China, gaining 1.2% this week.
- The Turkish lira was the best performing currency in emerging Europe this week, gaining 1.1%. The Pakistani rupee was the best performing currency in Asia, gaining 1.8%.
- The China Manufacturing PMI jumped to 50.2 in June from 49.6 in May, crossing above the 50 mark, the level that separates growth from contraction. The Non-Manufacturing PMI improved as well, increasing to 54.7 from 47.8.
Weaknesses
- The worst performing country in emerging Europe for the week was Russia, losing 7.7%. The worst performing country in Asia this week was Taiwan, losing 5.7%.
- The Russian ruble was the worst performing currency in emerging Europe this week, losing 4.7%. The Indonesian rupiah was the worst performing currency in Asia this week, losing 0.9%.
- The Final Eurozone Manufacturing PMI for June was reported at 52.1, below May’s level of 54.6. Production activity in Europe continue to weaken. The manufacturing index was at 63.4 in June of 2021.
Opportunities
- Leaders of the Group of Seven rich democracies met this week in Europe. This gathering presented opportunities to show a united front on supporting Ukraine for as long as necessary. The war in Europe was the main topic, but discussions also revolved around the energy shortage in Europe and replacing Russian oil and gas imports.
- The Polish banking index has lost 35% year-to-date, and Wood & Company sees this level as a “conditional buying opportunity.” Broker’s Research Team forecasts their median adjusted 2022 estimated net profit to almost double year-over-year. This implies this year’s adjusted return on equity (ROE) of 20%, a level not seen for over a decade.
- During the NATO meeting in Europe this week, the U.S. administration announced an expansion to its military presence in Europe. One hundred thousand U.S. army personnel will be stationed in Europe, up from 80,000, before Russia attacked Ukraine at the end of February of this year. NATO leaders also agreed to move towards putting more than 300,000 troops at higher readiness. In the past, NATO had around 40,000 to respond to any Russian attack or other crises.
Threats
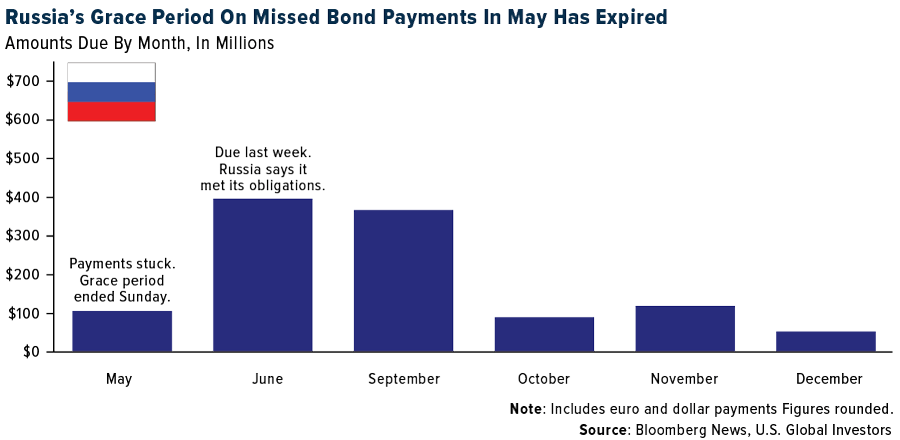
- Russia defaulted on its foreign-currency sovereign debt for the first time in a century. Last Sunday, the grace period on about $100 million interest payments expired. Russia says it is not in default and is able to make further payments, but it may not be able to meet its obligation due to sanctions imposed the United States and the West.
- A Turkish banking regulator restricted commercial loans in the Turkish lira to corporate borrowers if they hold more than TRY 15,000,0000 ($890,000) in foreign currency and if the amount exceeds 10% of total assets or annual sales. Year-to-date, the lira is the world’s weakest currency, losing more than 20% against the dollar, and further weakness could follow.
- Last Sunday, Russia launched an attack on Kyiv. Kyiv Mayor Vitali Klitschko said at least one apartment building was hit in the shelling. At least one person was killed, and several were injured in the attack, including some who were trapped in the rubble when two buildings were hit, rescue officials said.

Energy & Natural Resources
Strengths
- The best performing commodity for the week was lumber, up 15.59% after news that mortgage rates fell for the first time in four weeks. Year-to-date, lumber is off more that 40% with the rise in interest rates and a reduced supply chain. Ivanhoe Electric Inc. completed its initial public offering (IPO) this week, raising $169.1 million in what has been a rough market for raising capital. Ivanhoe Electric has proprietary electric pulse-powered geophysical surveying transmitter technology with mineral resources and other properties within the U.S.
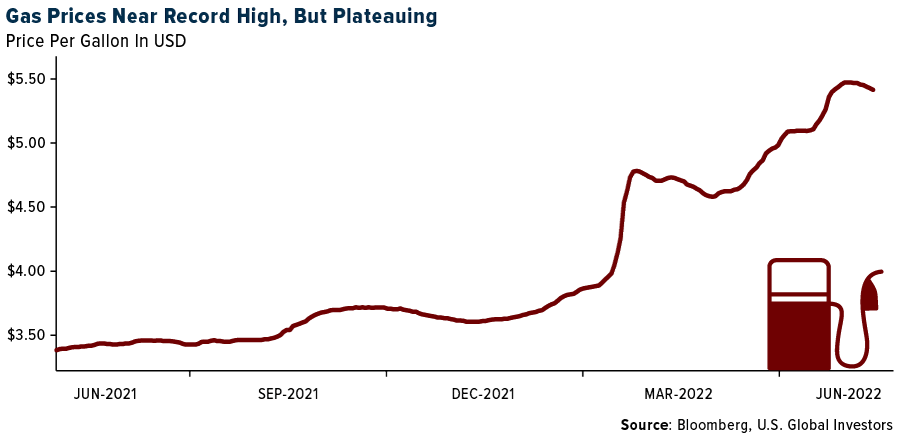
- The national average price for regular unleaded gasoline reached $5.03 per gallon on June 16, reports Barron’s, the highest on record. However, the price has eased back a bit, posting a weekly decline in the period ending June 20, for the first time in nine weeks. President Biden proposed a suspension of federal gas taxes to reduce prices at the pump, the article continues, though analysts are not sure if it will have much of a decline for drivers. Currently, the federal tax on gasoline is 18.4 center per gallon.
- U.S. natural gas production has increased to an average of 94.5 billion cubic feet per day (Bcf/d) in June, up 2% or 1.9 Bcf/d compared to the first quarter, according to S&P Global | Platts. Production growth in the quarter has come primarily from the Haynesville (up 600 MMcf/d since March, with the basin rig count above 70, its highest level in a decade, according to Enverus). The growth also marks a recovery from the pullback earlier in the year after reaching highs of 96 Bcf/d in late 2021. According to the International Energy Agency (IEA), for the first time, the U.S. is supplying more natural gas to Europe than Russia sends by pipelines.
Weaknesses
- The worst performing commodity for the week was wheat, down 10.20% as grain futures fell on fears that economic weakness will slow demand in the face a United States Department of Agriculture (USDA) report showing farmers intended to increase planted acreage of corn. China’s lockdown took almost 25% of the price of iron ore over the past quarter. In aggregate, the London Metal Exchange Index tumbles 25% over the quarter with tin being the worst followed by aluminum and then copper.
- U.S. vehicle miles traveled (VMT) were recently released for the month of April. Overall, U.S. seasonally adjusted VMT per day in April was down 0.4% versus 2019 (versus up 1.4% versus 2019 in March). This compares with April preliminary gasoline demand being down 6.5% versus 2019, as per the Department of Energy’s weekly averages. California VMT were down 12.6% versus 2019 in April.
- U.S. natural gas futures have clocked three straight weeks of declines, making the past month the first monthly decline February on stranded gas supplies due to the Freeport LNG facility under repairs post their fire. Oil prices are heading for first monthly drop since November as recession worries mount going in to an OPEC+ minister meeting which is expected to incrementally boost supplies.
Opportunities
- Despite the recent weakness in natural gas, investors are unfazed. The ProShares Ultra Bloomberg Natural Gas ETF’s (ticker BOIL) performance plunged nearly 60% in June; however, the fund saw record inflows of $254 million, cancelling out the decline to price with new assets coming into the fund. This likely reflects that stranded gas situation in the U.S. which traders believe will unwind with the Freeport LNG facilities comeback online. Prices have declined due to limited access to what is an extremely robust world market for natural gas.
- RBC expects price strength in potash to continue for at least the next two to three years, even with volume expansions out of Nutrien/Mosaic, as it still does not fill the gap left from potash supply removed from Russia/Belarus (i.e., supply deficit still in place in the near-term). Regarding nitrogen and phosphate, RBC currently forecasts more balanced, but tight, market conditions as Russian exports have returned and pressured prices during the already seasonally weak period.
- Rystad Energy research shows that installations and investments in the global offshore wind industry are set to surge this decade as nations seek to transition to cleaner sources of energy. The research shows total capex projected to more than double from $46 billion in 2021 to $102 billion in 2030. Driving this growth is a significant uptick in capacity installations in Europe, solidifying the region’s place as the global leader in the offshore wind space. Capital expenditure in Europe in 2030 is forecast to approach $53 billion, up from $15 billion last year.
Threats
- Russian pipeline flows have fallen by two-thirds over the last several weeks alone, increasing the near-term supply shortfall and pushing global prices over 50% higher since the start of June. There is no easy path to meeting Europe’s rising call on LNG. Furthermore, as China returns from lockdown, its pull on global LNG is likely to increase again later this year, adding yet another strain to the market. As a result, prices will need to remain elevated to constrain demand while heightened volatility is likely to persist.
- As of May 2022, refining capacity stands at 17.9bpd with utilization at near-record highs, the refinery margins are also at a record high. The latest utilization rate stands at 95%, the current rate is seasonally above the last three years which is important ahead of the summer driving season. For reference, the last peak was in September 2019 at 95.1%.
- Bloomberg reports the greater than half of the 38 climate lawsuits filed against businesses globally last year included firms outside of traditional fossil fuel industry. According to a report from the London School of Economics’ Grantham Research Institute on Climate Change and the Environment those industries included producing plastics, transport and clothing companies, and agriculture. The number of climate cases have doubled since 2015 where they historically have been filed in the U.S. but a growing number are showing up in the developing world where they are bearing the brunt of climate change.
Luxury Goods
Strengths
- China announced this week that it has cut its quarantine time for international travelers from three weeks to 10 days, reports Bloomberg. This update to travel restrictions should prove positive for the luxury sector and may boost consumer confidence after months of lockdowns in some of the Asian nation’s biggest cities.
- Louis Vuitton opened its first restaurant in France on June 17, reports Bloomberg, just in time for the summer season. The fashion brand owned by luxury conglomerate LVMH SE opened the dining spot in the Riviera town of Saint-Tropez. This is only the second restaurant from Louis Vuitton – the first opened in Osaka, Japan, in 2020.
- Sands China, a Chinese hotel and casino operator, was the best performing S&P Global Luxury stock for the week, gaining 24.0%.
Weaknesses
- Shanghai’s total consumer spending from January and May dropped more than 18% year-over-year to 604.754 billion renminbi ($90.42 billion), according to the latest data released by the Shanghai Municipal Bureau of Statistics. Retail apparel, which accounts for 24.2% of total spending, fell 17.8% to 146.177 billion renminbi ($21.86 billion), during the two-month lockdown imposed to contain the spread of Covid.
- Bloomberg reported that the forward price-to-earning ratio for luxury goods has fallen to 20 from 23 in March and 30 in December. Regardless of the drop, Bloomberg economists have maintained some confidence in earnings being able to beat sales growth this year. Year-to-date global luxury stocks as measured by S&P Global Luxury Index are down 30%.
- RealReal Inc., an online retailer, was the worst-performing S&P Global Luxury stock losing 32.0%. Stifel Nicolaus cut the company’s price target from $6 per share to $4.
Opportunities
- United Kingdom-based Blantyre Capital Limited is planning to open as many as 12 luxury hotels in Italy by the end of 2024, betting that tourism in the country will continue to recover. Italy’s GDP contracted almost 9% in 2020 and the economy bounced back with 6.6% growth last year. During the pandemic, the hotel, restaurant, and services sectors were among the most impacted, and are now beginning to show signs of recovery. Trade association Assorturismo Confeserecenti expects 5.5 million more tourists this summer compared with last year in the country’s main historic cities, including Venice, Rome, and Florence.
- According to Citi analyst Thomas Chauvet, the luxury sector offers favorable risk/reward at current valuation levels, even assuming a slower recovery in Chinese demand and slower growth in developed markets. The broker recommends owning Louis Vuitton, Kering and Richemont.
- French personal care company L’Oreal has brought back leading luxury brand Lancome to the Indian market after a five-year gap, Bloomberg reports. L’Oreal’s India Managing Director Amit Jain said the Indian beauty industry is undergoing a transformation. Over recent years, the rise in high-end and luxury categories in the personal care and beauty segments has been a witness to the transformation.
Threats
- Deutsche Bank recently held its 19th Annual Consumer Conference with over 90 companies attending across consumer staples, luxury, and retail segments. One of the key takeaways from the conference was that there will be a slower recovery in China post re-opening. However, this is offset in part by robust trends continuing in the United States and Europe. Europe is supported by a return to tourism in the U.S.
- Nike Inc. stock fell on Tuesday, reports Bloomberg, after the world’s largest sportswear company gave a downbeat full year forecast as sales slide in the vital China market. Even as the company reported results that surpassed analysts’ estimates and overcame supply-chain pressures that have persisted for many months, Nike said it expects gross margin to be flat to down 50 basis points, the article continues. Sales in the greater China region, where the company has struggled over the last year, fell 20% in the quarter.
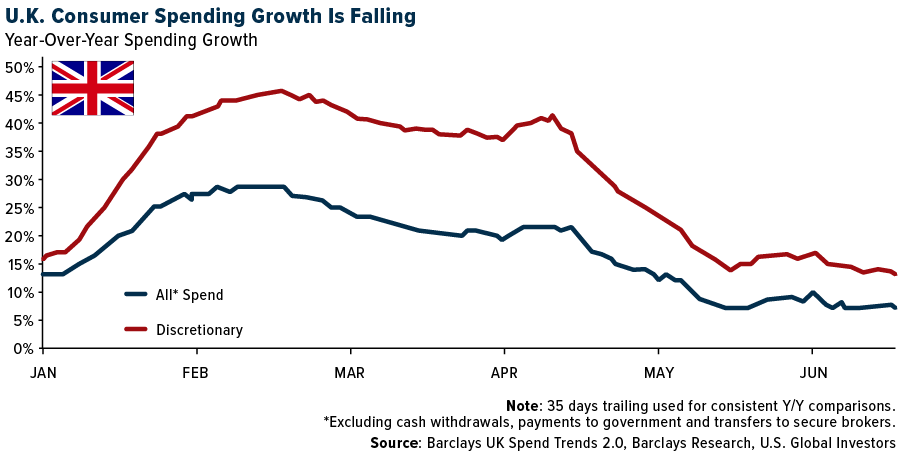
- Barclay’s Investment Sciences team published a report on U.K. consumer spending habits this week. The research team highlighted that spending growth in the region appears to be softening in the second quarter of this year. The year-over-year spending growth in Barclay’s credit card data has stepped down from more than 25% in February to only 10% in May.
Blockchain and Digital Currencies
Strengths
- Of the cryptocurrencies tracked by CoinMarketCap, the best performer for the week was Canadian Intuit, rising 1,640.52%.
- Sam Bankman-Fried’s FTX crypto exchange is exploring whether it might be able to acquire Robinhood Markets, according to people with knowledge of the matter. FTX is deliberating internally on how to buy the app-based brokerage, however Robinhood hasn’t received a formal takeover approach from FTX, writes Bloomberg. No final decision has been made and FTX could opt against pursuing a deal.
- Michael Saylor’s Bitcoin-backed tech firm MicroStrategy bought another 480 Bitcoins, worth about $10 million at the height of the current crypto market collapse. The firm purchased coins between May 3 and June 28 for about $20,817, according to paperwork filed with the U.S. Securities and Exchange Commission on Wednesday, reports Bloomberg.
Weaknesses
- Of the cryptocurrencies tracked by CoinMarketCap, the worst performing for the week was Zenfi, down 99.77%.
- Short sellers have been ramping up their bets against Tether, the world’s largest stablecoin, amid a broad market selloff that has called into doubt the financial health of some crypto companies. In the past month, more traditional hedge funds have executed trades to short Tether through Genesis Global Trading, one of the largest crypto brokerages for professional investors. These trades are worth “hundreds of millions” of dollars in notional value, said Leon Marshal, Genesis’ head of institutional sales, writes Bloomberg.
- Troubled crypto hedge fund Three Arrows Capital was ordered into liquidation by a court in the British Virgin Islands. The court, which made the order on Monday, has appointed two partners at consulting and advisory firm Teneo to handle Three Arrow’s liquidation, writes Bloomberg.
Opportunities
- The wipeout in Bitcoin may have run its course, according to one momentum indicator. The relative strength index (RSI) suggests Bitcoin’s selloff is due for a pause. The RSI, on a weekly basis, has fallen into “oversold” territory below 30 and is around the lowest level in data compiled by Bloomberg going back to 2010. The last time the gauge flashed “oversold” in 2018, the token went onto stage a strong rally, Bloomberg explains.

- Coinbase Global is turning abroad to fuel growth in new users and revenue, reviving an international push after laying off more than 1,000 of its predominantly U.S.-based workforce. The cryptocurrency exchange is focused on building up its presence in Europe and is in the process of registering in markets including Italy, Spain, France, and the Netherlands, writes Bloomberg.
- Bitcoin is on track for its worst quarter in more than a decade as more hawkish central banks and a string of high-profile crypto blowups hammer sentiment. The 58% drawdown in the biggest cryptocurrency is the largest since the third quarter of 2011, when Bitcoin was still in its infancy, according to Bloomberg data.
Threats
- Embattled crypto lender Celsius Network is resisting a recommendation from its own lawyers to file for Chapter 11 bankruptcy and seeking a show of support from users to help win the internal argument against the suits. With the company’s management prevented from making any public pronouncements due to legal advice, Celsius believes many of its retail clients would prefer the firm to avoid bankruptcy, writes Bloomberg.
- Yuga Labs Inc., creator of the popular Bored Ape Yacht Club NFTs, claims that conceptual artist Ryder Ripps scammed consumers into purchasing fake Bored Ape NFTs in a trademark infringement lawsuit filed in LA federal court. Ripps has made more than $5 million in pump-and-dump schemes involving the counterfeit NFTs called RR/BAYC which have been sold to more than 1,000 consumers, writes Bloomberg.
- The market for NFTs has been spiraling downward after sales sank sharply and the prices of popular NFTs plummeted over the last few weeks. The crypto niche is on course to record its first month with under $1 billion in sales since June 2021, according to data tracker DappRadar. On the world’s biggest NFT marketplace, OpenSea, sales volume has fallen 75% since May, and looks set to scrape the lowest levels since July 2021, writes Bloomberg.

Gold Market
This week, gold futures closed at $1,807.00, down $23.30 per ounce, or 1.27%. Gold stocks, as measured by the NYSE Arca Gold Miners Index, ended the week lower by 5.05%. The S&P/TSX Venture Index came in off 4.65%. The U.S. Trade-Weighted Dollar rose 0.93%.
| Date | Event | Survey | Actual– | Prior |
|---|---|---|---|---|
| Jun-27 | Hong Kong Exports YoY | 4.3% | -1.4% | 1.1% |
| Jun-27 | Durable Goods Orders | 0.1% | 0.7% | 0.5% |
| Jun-28 | Conf. Board Consumer Confidence | 100.0 | 98.7 | 106.4 |
| Jun-29 | Germany CPI YoY | 7.9% | 7.6% | 7.9% |
| Jun-29 | GDP Annualized QoQ | -1.5% | -1.6% | 1.5% |
| Jun-30 | Initial Jobless Claims | 230k | 231k | 233k |
| Jun-30 | Caixin China PMI Mfg | 50.2 | 51.7 | 48.1 |
| Jul-01 | Eurozone CPI Core YoY | 3.9% | 3.7% | 3.8% |
| Jul-01 | ISM Manufacturing | 54.5 | 53.0 | 56.1 |
| Jul-5 | Durable Goods Orders | 0.7% | — | 0.7% |
| Jul-7 | Initial Jobless Claims | 230k | — | 231k |
| Jul-8 | Change in Nonfarm Payrolls | 275k | — | 390k |
Strengths
- The best performing precious metal for the week was palladium, up 4.62%, as the U.K. sanctioned Nornickel’s major shareholder, oligarch Vladimir Potanin. Nornickel is the worlds’s top producer of palladium, supplying about 40% of world demand. Iraq’s central bank increased its gold reserves by 35% to reach 130.4 tons, with total new purchases of 34 tons, the bank said in a statement posted on its website. The statement included that “gold is one of the most important assets that central banks and international financial institutions maintain.” Ethiopia’s central bank raised its premium by six percentage points to 35% above global prices to buy gold produced by local artisanal miners which source about 65% of Ethiopia’s gold production. Gold has been under pressure for last quarter as the Federal Reserve began raising interest rates but remains resistant to closing under $1,800.
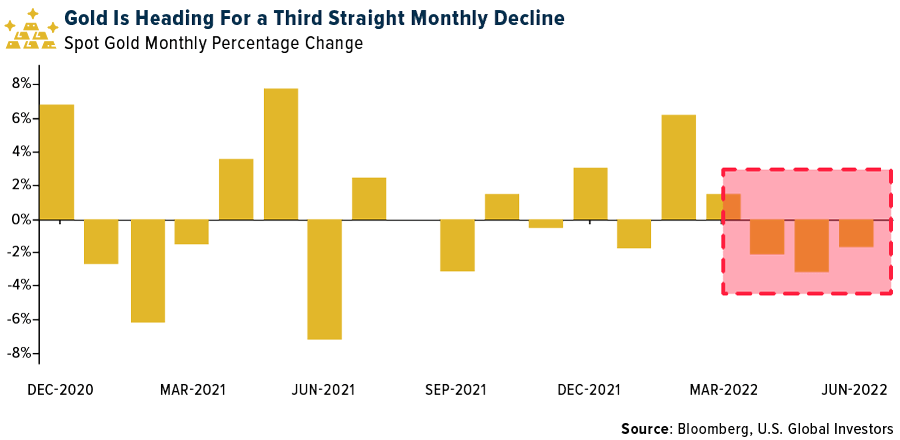
- Gold remains above $1,800 as U.S. consumer confidence dropped to a 16-month low in June as Americans grew more downbeat on the economy. Bank of America reported its customers transacting in crypto has shrunk by 50% with the bear market in Bitcoin. Bloomberg reported there are almost $4 billion in loans to crypto miners secured against the mining rigs as collateral. With the plunge in Bitcoin, the value of the mining rigs has fallen such that the loans could be called to liquidate the hardware. Wilfred Daye, CEO of Securitize Capital, noted for some miners that borrowed heavy could lead to a shakeout as these leveraged players need Bitcoin prices greater than $20,000 to cover infrastructure and interest rates.
- The Botswana government and Anglo American PLC’s unit De Beers Group have extended their agreement for the sale of rough diamond production from its join venture Debswana by a year to June 2023, reports Reuters. The traditional arrangement has been a 10-year contract; however, negotiations for a new agreement were deferred due to Covid (but are now extended for 12 months again). The De Beers structure in Botswana is unique in that it is a JV with the government (Debswana). De Beers receives 19.2% of profits but is not taxed. It then sells Debswana goods and shares in a mark-up for these, which accrues to its Trading division. Debswana volumes account for the majority of its trading profits.
Weaknesses
- The worst performing precious metal for the week was silver, down 6.40%. The Indian government raised the import tax on gold from 7.5% to 12.5% in a bid to curb imports as the rupee has sunk to a record low. In 2021, India imported the most in a decade.
- Evolution Mining fell by over 30% over the course of the week as it lowered its full-year gold output and trimmed expectations for the following two years. Investors had been expecting Evolution to return to production growth, considering recent acquisitions. Investors are paying more attention to reserve and production growth. Specifically, there is more pressure for miners with declining reserves and production to invest more in growth (preferably organic growth).
- Argonaut Gold completed a C$195 million equity raise with a concurrent US$250 million credit facility to construct the Magino Project. Argonaut’s share price fell 20% for the week and is down over 80% year-to-date. Victoria Gold fell almost 18% this past week as Coeur Mining sold half of their position in Victoria for corporate purposes.
Opportunities
- Stifel’s recent commentary on the global metals and mining industry highlights miners are poised to deliver outsized capital returns to shareholders through dividends and share buybacks over the coming years. While the phase of deleveraging following significant investment in growth over a decade ago is nearing completion, investing in new growth has been a challenge and continues to face obstacles. As a result, dividends and buybacks have become an attractive destination for excess cash sitting idle on the balance sheet. Therefore, Stifel believes that while the larger miners in its analysis are already paying an attractive average dividend yield of 5%, room for higher returns exist in the coming years as buoyant commodity prices and a lack of sizable growth opportunities create an ideal scenario for heightened shareholder returns.
- Junior explorer Dolly Varden Silver has started its 30,000-meter, 99-hole drilling campaign in the Kitsault Valley in northwest British Columbia’s Golden Triangle. As reported by Streetwise Reports, the company is utilizing three diamond drill rigs to upgrade and expand resources at the trend made up of multiple deposits and historic mines. In addition, Dolly Varden is looking to discover new silver and gold mineralization. “When we go to infill, the goal here is to move half of those ounces into the measured indicated category,” President and CEO Shawn Khunkhun said. “And I think what will happen is, we’ll also understand the controls of the system, which will enable us to guide the other 50% of the exploration program, which is the really exciting part of the program where we can really move the needle.”
- JPMorgan is cautious on near-term downside to gold equities ahead of concerns around weaker June quarterlies but remain positive on the macro backdrop maintaining its “overweight” call on the sector. Key takeaways from the bank’s market review include: 1) expectations of another set of weak quarterlies across its coverage, but belief that Newcrest may disappoint the most, versus current market expectations, and 2) recession or stagflation is looking increasingly likely on a one to two-year view, supportive of medium-term real yields and the gold price.
Threats
- Sibanye Stillwater provided an update on the impact of the regional flooding at its U.S. PGM operations. The company reported that floods had restricted access to its Stillwater mine. It also confirmed that several bridges in the vicinity of the mine have been damaged while the primary road from Nye to Stillwater has been severely eroded. This means the access to the mine remains restricted requiring the rerouting of water, tailings, and other piping. Remediation works have started but it is expected that production at Stillwater will remain suspended for approximately four to six more weeks.
- SSR Mining management states that it is aware of the reports and a social media post from the Ministry of the Environment indicating a potential temporary halt of operations at Copler and is seeking a formal response from the government. In the interim, operations are unaffected, and the company does not plan to suspend operations unless ordered to do so by the government. Copler accounts for 45% of operating NAV for SSR Mining.
- According to Morgan Stanley, the PGM miners have historically kept underground mining operations running as usual and dialed back power to the smelters to manage electricity demand during bouts of load shedding. The miners have then subsequently been able to process the backlog given spare smelter/precious metal refining capacity in the industry. However, as the intensity and duration of load shedding steps up, this may no longer be a valid assumption into the future, with all three major producers highlighting the risk to their ability to process metal.

U.S. Global Investors, Inc. is an investment adviser registered with the Securities and Exchange Commission (“SEC”). This does not mean that we are sponsored, recommended, or approved by the SEC, or that our abilities or qualifications in any respect have been passed upon by the SEC or any officer of the SEC.
This commentary should not be considered a solicitation or offering of any investment product. Certain materials in this commentary may contain dated information. The information provided was current at the time of publication. Some links above may be directed to third-party websites. U.S. Global Investors does not endorse all information supplied by these websites and is not responsible for their content. All opinions expressed and data provided are subject to change without notice. Some of these opinions may not be appropriate to every investor.
Holdings may change daily. Holdings are reported as of the most recent quarter-end. The following securities mentioned in the article were held by one or more accounts managed by U.S. Global Investors as of (03/31/22):
United Airlines
JetBlue Airways
Spirit Airlines
Ryanair Holdings PLC
Qantas Airways Ltd.
Anglo American Platinum Ltd.
Dolly Varden Silver Corp.
Sibanye Stillwater
SSR Mining
LVMH
Kering
Richemont
Nike
Ivanhoe Electric Inc.
*The above-mentioned indices are not total returns. These returns reflect simple appreciation only and do not reflect dividend reinvestment.
The Dow Jones Industrial Average is a price-weighted average of 30 blue chip stocks that are generally leaders in their industry. The S&P 500 Stock Index is a widely recognized capitalization-weighted index of 500 common stock prices in U.S. companies. The Nasdaq Composite Index is a capitalization-weighted index of all Nasdaq National Market and SmallCap stocks. The Russell 2000 Index® is a U.S. equity index measuring the performance of the 2,000 smallest companies in the Russell 3000®, a widely recognized small-cap index.
The Hang Seng Composite Index is a market capitalization-weighted index that comprises the top 200 companies listed on Stock Exchange of Hong Kong, based on average market cap for the 12 months. The Taiwan Stock Exchange Index is a capitalization-weighted index of all listed common shares traded on the Taiwan Stock Exchange. The Korea Stock Price Index is a capitalization-weighted index of all common shares and preferred shares on the Korean Stock Exchanges.
The Philadelphia Stock Exchange Gold and Silver Index (XAU) is a capitalization-weighted index that includes the leading companies involved in the mining of gold and silver. The U.S. Trade Weighted Dollar Index provides a general indication of the international value of the U.S. dollar. The S&P/TSX Canadian Gold Capped Sector Index is a modified capitalization-weighted index, whose equity weights are capped 25 percent and index constituents are derived from a subset stock pool of S&P/TSX Composite Index stocks. The NYSE Arca Gold Miners Index is a modified market capitalization weighted index comprised of publicly traded companies involved primarily in the mining for gold and silver. The S&P/TSX Venture Composite Index is a broad market indicator for the Canadian venture capital market. The index is market capitalization weighted and, at its inception, included 531 companies. A quarterly revision process is used to remove companies that comprise less than 0.05% of the weight of the index, and add companies whose weight, when included, will be greater than 0.05% of the index.
The S&P 500 Energy Index is a capitalization-weighted index that tracks the companies in the energy sector as a subset of the S&P 500. The S&P 500 Materials Index is a capitalization-weighted index that tracks the companies in the material sector as a subset of the S&P 500. The S&P 500 Financials Index is a capitalization-weighted index. The index was developed with a base level of 10 for the 1941-43 base period. The S&P 500 Industrials Index is a Materials Index is a capitalization-weighted index that tracks the companies in the industrial sector as a subset of the S&P 500. The S&P 500 Consumer Discretionary Index is a capitalization-weighted index that tracks the companies in the consumer discretionary sector as a subset of the S&P 500. The S&P 500 Information Technology Index is a capitalization-weighted index that tracks the companies in the information technology sector as a subset of the S&P 500. The S&P 500 Consumer Staples Index is a Materials Index is a capitalization-weighted index that tracks the companies in the consumer staples sector as a subset of the S&P 500. The S&P 500 Utilities Index is a capitalization-weighted index that tracks the companies in the utilities sector as a subset of the S&P 500. The S&P 500 Healthcare Index is a capitalization-weighted index that tracks the companies in the healthcare sector as a subset of the S&P 500. The S&P 500 Telecom Index is a Materials Index is a capitalization-weighted index that tracks the companies in the telecom sector as a subset of the S&P 500.
The Consumer Price Index (CPI) is one of the most widely recognized price measures for tracking the price of a market basket of goods and services purchased by individuals. The weights of components are based on consumer spending patterns. The Purchasing Manager’s Index is an indicator of the economic health of the manufacturing sector. The PMI index is based on five major indicators: new orders, inventory levels, production, supplier deliveries and the employment environment. Gross domestic product (GDP) is the monetary value of all the finished goods and services produced within a country’s borders in a specific time period, though GDP is usually calculated on an annual basis. It includes all private and public consumption, government outlays, investments and exports less imports that occur within a defined territory.
The NYSE Arca Airline Index is an equal-dollar weighted index designed to measure the performance of highly capitalized companies in the airline industry.
The NYSE Arca Global Airline Index is a modified equal- dollar weighted index designed to measure the performance of highly capitalized and liquid international airline companies.
A dividend is the distribution of a company’s earnings to its shareholders and is determined by the company’s board of directors. Dividends are often distributed quarterly and may be paid out as cash or in the form of reinvestment in additional stock.
The S&P Global Luxury Index is comprised of 80 of the largest publicly-traded companies engaged in the production or distribution of luxury goods or the provision of luxury services that meet specific investibility requirements.
The S&P Municipal Bond Index is a broad, market value-weighted index that seeks to measure the performance of the U.S. municipal bond market.
The S&P Global Natural Resources Index includes 90 of the largest publicly traded companies in natural resources and commodities businesses that meet specific investability requirements.
The Relative Strength Index (RSI) is a momentum indicator that measures the magnitude of recent price changes to analyze overbought or oversold conditions.
Gallup’s Economic Confidence Index combines the responses of Gallup’s Economic Conditions and Economic Outlook measures. Daily results are based on telephone interviews with approximately 1,500 national adults; Margin of error is ±3 percentage points.
London Metal Exchange Index consists of 6 metals with the following weights: aluminum (42.8%), copper (31.2%), zinc (14.8%), lead (8.2%), nickel (2%) and tin (1%). Weightings of the six metals are derived from global production volume and trade liquidity averaged over the preceding five-year period. The index value is calculated as the sum of the prices for the three qualifying months multiplied by the corresponding weights, multiplied by a constant.


