


Frank Talk
Manufacturing Weakness Could Signal Trouble for the Economy
Date Posted: September 9, 2024
Read time: 7 min
The U.S. economy could be heading into choppy waters, and investors may be wise to buckle up. Recent data suggest that storm clouds could be gathering, with declines in U.S. manufacturing, a softening labor market and worrisome signs from the bond market all pointing to possible trouble ahead.
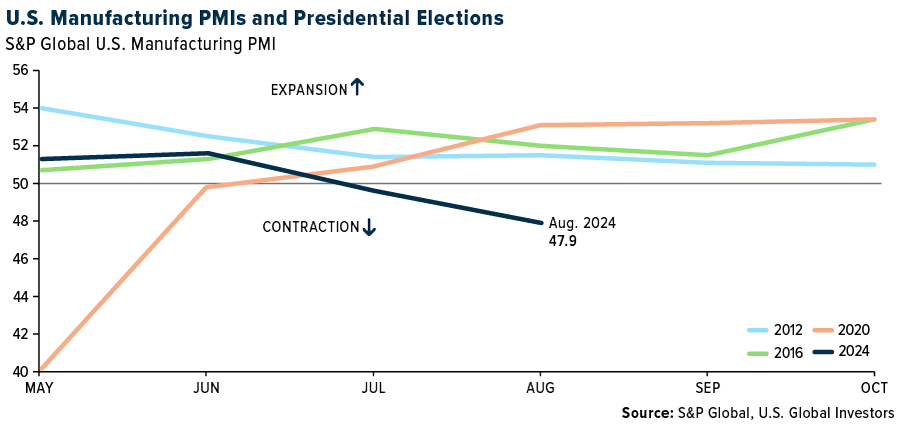
Manufacturing production signaled a significant weakening in demand in August. The S&P Global U.S. Manufacturing PMI posted a reading of 47.9, its lowest level in 2024 so far. Any PMI below 50 indicates contraction, and this is now the second consecutive month of declines.
Weakness in manufacturing isn’t just a concern for the stock market. The industry is contracting at a time when Kamala Harris, the incumbent-party presidential candidate, is hoping to run on the administration’s economic success.
If Harris takes office at a time when the business cycle is faltering, she’ll face an uphill battle with a slowing jobs market, lagging home sales and a Federal Reserve caught between a rock and a hard place on interest rates. Geopolitical risks also continue to swirl in the background, creating even more uncertainty.
But the U.S. isn’t alone in this struggle. In August, the JPMorgan Global Manufacturing PMI fell to 49.5, an eight-month low. Out of 31 countries surveyed, 18 showed deterioration in manufacturing conditions, including those in the euro area and Japan. The slowdown isn’t confined to our shores—it’s a global issue that could have ripple effects on trade, jobs and investment opportunities.
Mixed Signals from the Sahm Rule
The U.S. labor market has long been a source of strength for the economy, but it, too, is starting to send worrying signals. August’s jobs report was underwhelming, and while the unemployment rate is still relatively low, the trend is going in the wrong direction. In July, the unemployment rate ticked up to 4.3%, which triggered what’s known as the Sahm rule, a little-known but highly accurate recession indicator named after former Fed economist Claudia Sahm. As I discussed with you last month, the rule has successfully predicted every U.S. recession since 1970, so when it’s activated, people take notice.
Payroll gains have also slowed over the past several months, and many economists expect that we’ll see downward revisions in the number of jobs added. All of this is happening as inflation remains a persistent thorn in the side of policymakers, complicating the Fed’s job as it tries to balance controlling prices with avoiding a deeper slowdown in the economy.
Sahm herself has expressed concern that the Fed might not be acting quickly enough to avoid a recession. “The Fed can no longer afford to move gradually,” she said recently in an interview with Goldman Sachs. “Twenty-five basis point cuts would probably suffice to avoid the worst possible economic outcomes, but these cuts have to be delivered decisively, not gradually.”
The End of the Yield Curve Inversion That Just Wouldn’t Quit
One of the most reliable recession indicators over the last 50 years has been the yield curve, and last week, it turned positive again for the first time in over two years. An inverted yield curve, where short-term rates are higher than long-term rates, has preceded every U.S. recession since the 1970s. This occurs because market participants, anticipating future rate cuts to combat a downturn, drive long-term rates lower.
Typically, the spread between the 10-year and two-year Treasury notes is used to gauge this inversion. Before last week, the yield curve had been inverted for a staggering 783 consecutive days, the longest such period in U.S. history. Although the inversion has recently “uninverted,” meaning long-term rates are no longer lower than short-term rates, the damage may already be done.
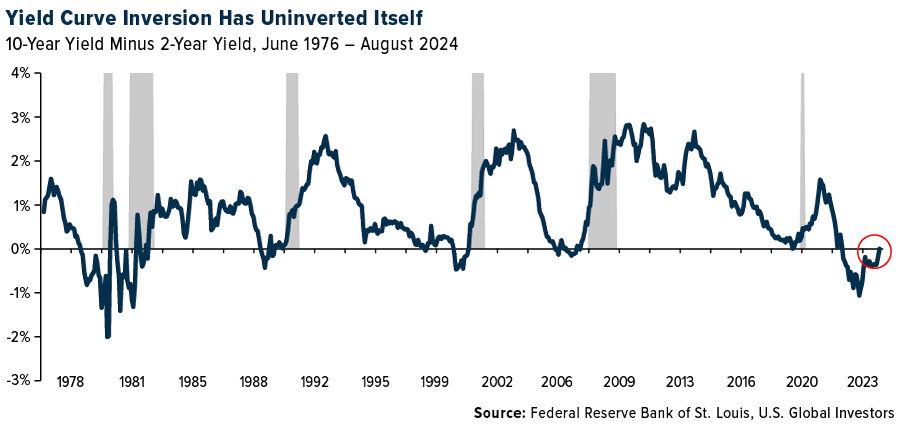
Historically, there’s been about a 12-month lag on average between the first inversion and the onset of a recession. But this can vary. For instance, the curve first inverted in January 2006, roughly two years before the financial crisis began in 2008. If history is any guide, the prolonged inversion we just experienced could be setting the stage for another economic downturn.
A 30% Decline in the S&P 500?
What does all this mean for investors? According to Peter Berezin, Director of Research at BCA, it may be time to rethink your portfolio strategy. Writing in the Financial Times, Berezin says that now may be the moment to rotate out of stocks and into bonds. For the last two years, stocks have been the place to be, but with a recession potentially on its way, Berezin believes bonds will soon offer a better risk-reward balance.
In a recessionary scenario, Berezin expects the S&P 500’s forward price-to-earnings ratio to fall from 21 to 16, with earnings estimates dropping by 10%. This would bring the S&P down to 3,800—an almost 30% decline from current levels. It’s a sobering prediction, but one that can’t be ignored, especially given the headwinds facing the global economy.
The Fed’s Next Move
The Federal Reserve has been in a rate-hiking cycle for over two years now, but with economic data weakening, many expect that rate cuts are on the horizon. The first cut is anticipated to come at the September 17-18 FOMC meeting, with a reduction of 0.25% to 0.50%. While some might hope that this will stave off a recession, it’s important to remember that rate cuts take time to filter through the economy.
There’s also the risk that the Fed could be too slow in its actions. Sahm, Berezin and others argue that decisive cuts may be necessary to avoid the worst outcomes. The longer the Fed waits, the harder it will be to reverse the course of a slowing economy.
As always, I remain optimistic about the long-term potential of the U.S. economy, but the short-term outlook is uncertain. Now may be the time to reexamine your portfolio and prepare for the possibility of a slowdown. History shows that recessions are an inevitable part of the business cycle, but they can also present opportunities for savvy investors who are prepared.
Stay focused, stay informed and as always, happy investing!
Past performance does not guarantee future results. All opinions expressed and data provided are subject to change without notice. Some of these opinions may not be appropriate to every investor. By clicking the link(s) above, you will be directed to a third-party website(s). U.S. Global Investors does not endorse all information supplied by this/these website(s) and is not responsible for its/their content.
The S&P 500 Index is a widely recognized capitalization-weighted index of 500 common stock prices in U.S. companies. The Purchasing Managers’ Index (PMI) is a measure of the prevailing direction of economic trends in manufacturing. The price-to-earnings ratio equals the price of a share of stock, divided by the company’s earnings-per-share. It tells you how much you are paying for each dollar of earnings.