


Investor Alert
How Airlines Stay Highly Profitable Despite Falling Ticket Prices
Date Posted: July 14, 2023
Read time: 37 min
Falling airfare prices in the U.S. don’t appear to have any effect on airlines’ revenue, according to Goldman Sachs. In fact, Delta just reported record revenue and profits in the June quarter.
For those of you who happened to buy a plane ticket in the past month, you may have noticed a welcome change in price. Airfare was down a good amount in June compared to the same month in 2022 (-18.9%) and compared to May (-8.1%), according to this week’s consumer price index (CPI) data.
Declining jet fuel costs were the largest contributor to lower fares.
Although this benefits consumers, especially during the busy summer travel months, investors may be wondering: Will airlines generate less revenue as a result? Not so fast.
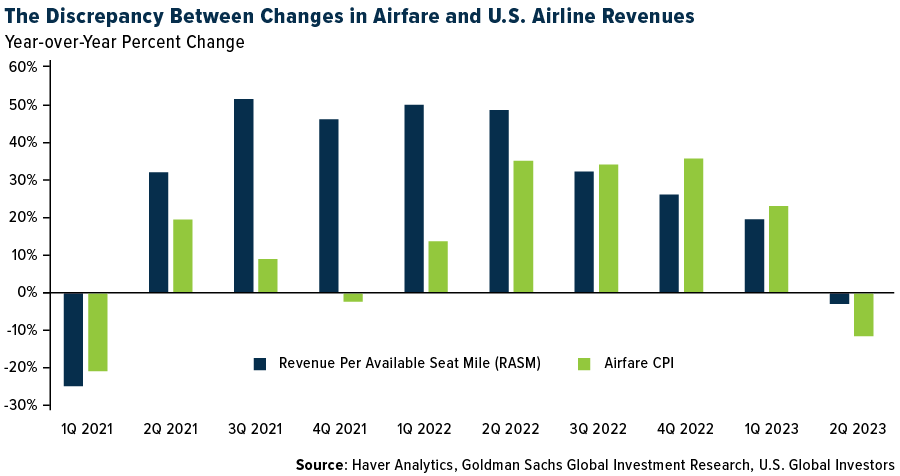
In a letter out this week, Goldman Sachs reports that there doesn’t appear to be a meaningful relationship between airfare CPI and U.S. airlines’ revenue per available seat mile (RASM). Investors, therefore, need not worry—at least not about falling ticket prices.
Check out the chart below. It compares annual percent changes in airfare and airline revenue per seat. Goldman found that there isn’t a strong link between the two, meaning that just because ticket prices are dropping, it doesn’t necessarily mean that carriers are making less money. The bank estimates that second-quarter RASM was off 3% compared to last year’s quarter, but that’s a far cry from how much fares fell during the same period.
Discrepancies Between CPI and RASM in the Airline Industry
So why the discrepancy? The Goldman report doesn’t provide many insights, but I think I can offer a couple.
For one, the Bureau of Labor Statistics (BLS), which issues the monthly CPI, and the airlines are measuring two separate things. The CPI allegedly measures the average change in prices paid by urban consumers for air travel over time (though I’ve raised questions about the methodology many times in the past, most recently here). On the other hand, RASM is an airline industry metric that measures an airline’s operating earnings per seat per mile flown—its efficiency, in other words.
The bigger reason for the discrepancy, as I see it, is revenue composition. As I’ve shared with you many times before, airlines make money in many more ways than simply selling tickets. Ancillary revenues, including fees for non-ticket items like extra luggage, seat selection and onboard food, play an increasingly important role in an airline’s total revenue. Baggage fees alone generated a whopping $29 billion for carriers around the world in 2022, according to IdeaWorks.
None of these fees are captured in the airfare CPI, but they surely contribute to RASM.
Other things the CPI appears to get wrong about airfare? It excludes business travel, even though this form of travel involves higher fares than leisure travel due to last-minute bookings, changes, cancellations and added services. The CPI also gathers ticketing data from the Department of Transportation (DOT), which includes only about 10% of tickets sold. Airlines, by comparison, have access to 100% of the data, so they have a much fuller and more accurate understanding of airfare trends.
Delta Reports Record Quarterly Earnings and Profitability
If you need additional proof that lower airfares don’t necessarily impact earnings, look no further than Delta Air Lines. This week, the carrier reported record earnings and profits in the June quarter on booming travel demand and cheaper fuel, and it gave investors a heads-up to expect another quarter of record revenue in September. Delta raised its 2023 full-year earnings per share (EPS) guidance to between $6 and $7, up substantially from earlier estimates of between $5 and $6 per share.
United Airlines and American Airlines, both scheduled to report next week, are also forecast to have their best quarterly EPS since 2019.
The earnings boom has helped airline stocks soar in 2023. Investor’s Business Daily (IBD) said this week that the 19 companies in its Transportation-Airline industry group have increased nearly 50% so far this year, making them the eighth-best-performing industry in 2023 among 197 that the publication tracks.
Gearing Up for Growth
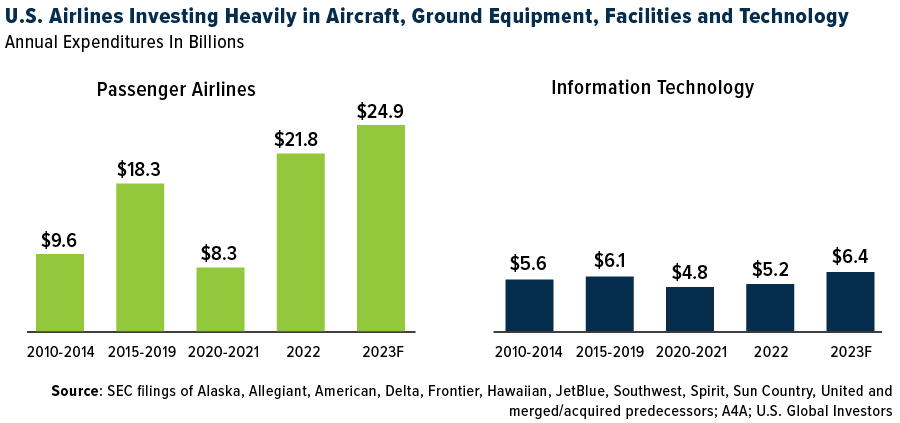
Another sign that airlines are bracing for future growth is the incredible amount they’re investing in aircraft, ground equipment, facilities, technologies and other expenditures. In the U.S. alone, airlines are expected to spend nearly $25 billion this year on passenger aircraft and close to $6.5 billion on information technology (IT), which would be a record high in both cases, according to the latest report by Airlines for America (A4A).
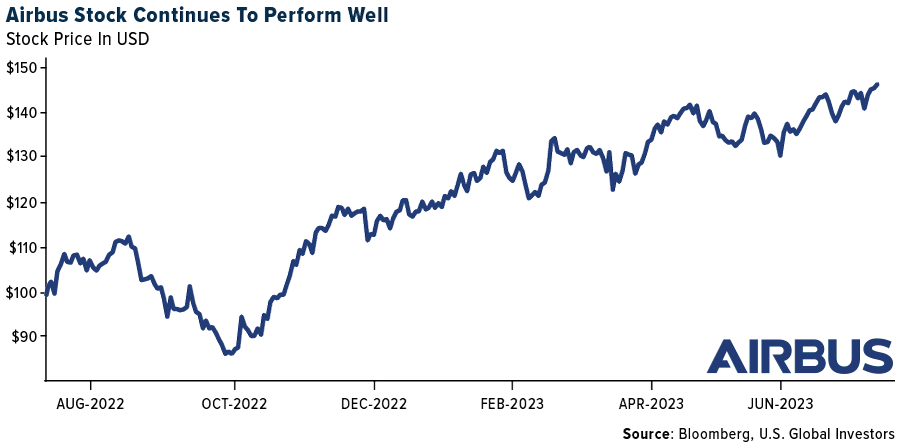
In June, Boeing delivered 60 new aircraft, its highest since March, despite lagging behind its European rival Airbus, which delivered 72 aircraft in June, for a total of 316 planes so far this year. Boeing’s notable orders included 40 787 Dreamliners for the new Saudi carrier Riyadh Air, confirmed at last month’s Paris Air Show.
Airbus has a substantial backlog of almost 8,000 aircraft, predominantly single-aisle jets like the A320neo and A321neo. This backlog represents about eight years of production. The manufacturer also booked orders for 902 aircraft, primarily from Air India and IndiGo, accounting for over 70% of its order book.
Meanwhile, here in the U.S., Southwest Airlines plans a $450 million expansion at Houston’s William P. Hobby Airport, adding seven new gates operational by 2026 (six exclusively for Southwest), additional baggage carousels and restroom upgrades. This move facilitates growth in Texas, where Southwest’s Dallas Love Field operations are capped at 20 gates.
Watch our latest video, “7 Terms to Know When Investing in Airlines,” by clicking here!

Index Summary
- The major market indices finished up this week. The Dow Jones Industrial Average gained 2.29%. The S&P 500 Stock Index rose 2.32%, while the Nasdaq Composite climbed 3.32%. The Russell 2000 small capitalization index gained 3.53% this week.
- The Hang Seng Composite gained 5.27% this week; while Taiwan was up 3.72% and the KOSPI rose 4.02%.
- The 10-year Treasury bond yield fell 20 basis points to 3.828%.
Airlines and Shipping
Strengths
- The best performing airline stock for the week was Cathay Pacific, up 5.5%. Delta reported June quarter adjusted earnings per share (EPS) of $2.68, above the high end of its recently improved guidance of $2.25 to $2.50, and ahead of consensus of $2.40. The beat versus consensus was due to better revenue and non-operating costs.
- The Korean shipbuilding sector lagged the KOSPI throughout the first quarter, but staged a strong rally entering the second quarter, ending the first half of the year as one of the best-performing sectors in Korea. Despite various macro concerns and a softer order environment versus last year, Korean shipbuilders have so far been well on track with their order targets, with HHI Group names pacing ahead and SHI also expected to meet with well-anticipated LNG carrier orders from Qatar in the second half.
- Air travel prior to the July 4th holiday week broke records, though airline operations were not as smooth. Prior to the July 4th holiday, between Thursday, June 29th and Sunday July 2nd, TSA passenger throughput numbers came in 16% above 2019 levels, on average. The Friday before the holiday weekend broke TSA records with 2.8 million passengers screened through TSA checkpoints (32% above 2019 levels), which broke the previous record set during the Sunday after Thanksgiving in 2019, according to the Washington Post.
Weaknesses
- The worst performing airline stock for the week was Azul, down 11.2%. United Airlines’ CEO Scott Kirby recently blamed the Federal Aviation Administration (FAA) for the increase in cancelations before the July 4th holiday week. According to Reuters, Mr. Kirby wrote in a memo to employees that “over 150,000 customers on United alone were impacted this weekend because of FAA staffing issues and their ability to manage traffic.”
- In June, containerships recorded 295,170 TEU of vessel deliveries, out of which 82% was 8,000+ TEU container ships, according to Clarkson. The deliveries accounted for 1.1% of the total fleet in June and this was the highest monthly level since 1996. There could be sustained pressure from new deliveries in coming quarters.
- The U.S. Department of Transportation reported May full-time equivalent employees at U.S. airlines totaled 495,000, up 0.8% from April 2023 and up 10.5% from May 2019. Airlines continue to do less (flying) with more (people), a trend that may continue for the next half decade. In addition to higher pilot salaries, there will be higher salaries for aircraft maintenance technicians as AMTs retire during this decade. To attract and retain people, wage rates will increase as contracts become amendable.
Opportunities
- Airbus SE announced 189 total deliveries for the second quarter of 2023, delivering 72 aircraft in June. The company delivered a total of 150 A320 aircraft including 1 A319neo, 61 A320neos, and 88 A321neo variants. With today’s deliveries, the company is in a better position to meet its full-year delivery goal of 720 aircraft in 2023.
- According to JPMorgan, compared to other freight rate indices, CTS data includes a far broader range of trade lanes, with 49 individual regions and a global composite. SCFI, on the other hand, only measures rates on exports from Shanghai. More generally, JPMorgan notes that, in May, the CTS rates remained 41% above the 2019 average level, whereas SCFI was 21% higher. This supports the view that SCFI overstates the level of global market weakness.
- JPMorgan is also bullish on LCCs. The key reasons for its constructive view include: 1) the bank sees upside potential to earnings across all three LCCs (mostly on better revenue) and 2) valuations are wholly undemanding.
Threats
- A Times article this week estimates that up to one-third of all European flights are at risk of being delayed or cancelled this summer after air traffic controllers said they would strike. Controllers at Eurocontrol, the European air traffic management body, revealed that they would walk out over the peak summer period after talks over staffing, rosters, and pay broke down. Airlines and airports alike have been warning that this is the biggest threat to summer operations with demand seemingly remaining very strong.
- The steeper path for emission cuts does mean that ships ordered to use conventional fuel within the last several years could be facing a very challenging degree of tail risk. Even the most efficient oil-based fuel will likely not meet the 2040 standards, meaning a ship ordered now may only have a 15-year useful life (assuming 2025 delivery), which is well below the 20–30-year target depending on type and size.
- According to ISI, JetBlue is up 37% in one month following an obviously negative fundamental outcome (lost NEA ruling). While there will be twists and turns along the way, ISI believes the Spirit acquisition ultimately gets done while the premium JetBlue is paying for Spirit continues to expand.
Luxury Goods and International Markets
Strengths
- Inflation numbers in the United States were released on Wednesday, July 12, and came in lower than predicted. The market instantly reacted positively to the news, bond rates began to fall, and future Federal Reserve expectations became more dovish. The Fed is still expected to raise rates one or two more times, but if the market shows us additional slowdowns in inflation in the future, we may see an earlier pivot point on rates.
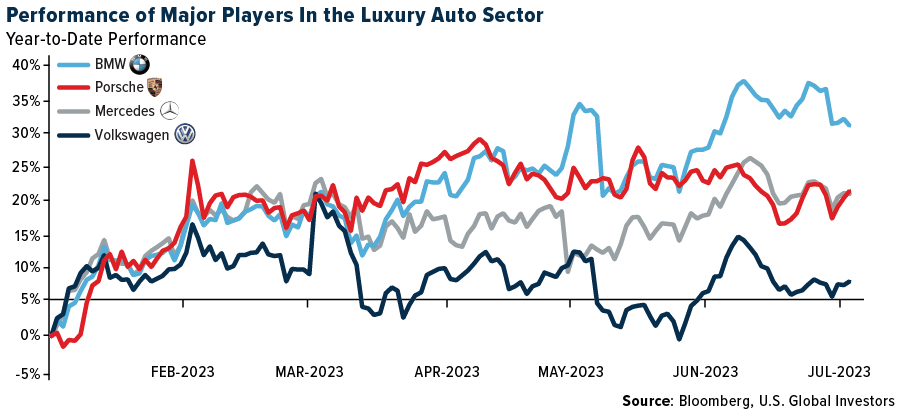
- German automakers are performing strongly year-to-date, as seen in the chart below. BMW is leading the pack gaining while Volkswagen comes in last place. Despite economic difficulties and a technical recession in the Eurozone, this sector of the market remains strong. Mercedes recently announced a rise in sales of 6% for the second quarter along with 515,700 vehicles sold. Electric vehicle (EV) sales increased 123%, an additional 56,300 cars, while all other segments also showed strong demand.
- Faraday Future Intelligent was the best performing S&P Global Luxury stock in the past five days, gaining 30.31%. Shares started to move higher this week after the company announced a new chief financial officer, Jonathan Maroko.
Weaknesses
- Carnival Corporation’s valuation is hindered by its increased debt levels and historically modest return on investment, both of which have been exacerbated by the pandemic. The company’s elevated debt burden and historically lower profitability have weakened its position, making it less appealing as an investment opportunity when compared to other options, especially given the uncertain global economic conditions.
- Taxes may prevent Prada from becoming a blue-chip contender. According to Daniel Wong, director and chief index officer of Hang Seng Index Co., the fact that Prada SpA shares are subject to Italian capital gains tax and dividend withholding taxes, will be considered when deciding which foreign firms to include in Hong Kong’s blue chips index beginning in November.
- Lucid Group Inc. was the worst performing S&P Global Luxury stock in the past five days, losing 10.07%. The company undershot delivery expectations for the quarter. It shipped 1,404 electric sedans instead of the estimated 1,873. However, it announced the start of shipments to Saudi Arabia, its biggest financial backer, which contributed $1.8 billion of the recently raised $3 billion. The Saudi sovereign wealth fund owns approximately 60.5% of Lucid. Additionally, Lucid secured a deal with Aston Martin for supplying EV powertrain components.
Opportunities
- Kering paid $3.8 billion to acquire high-end French fragrance label Creed in June, reports Reuters, after flagging intentions earlier in the year to create an in-house cosmetics business. The company also hopes that the acquisition will improve its chances of competing against Louis Vuitton and Hermès.
- Shiseido’s one-billion-yen investment and strategic cooperation in the CHITOSE Group-led MATSURI initiative, enables it to capitalize on the growing market for sustainable cosmetics. Shiseido can attract environmentally concerned consumers, boost its market position, and align with the global trend toward sustainability, while achieving long-term growth and profitability, by pioneering microalgae-based ingredients.
- Burberry has high expectations for the first quarter, with revenues projected to move higher from tourist spending in Europe and Asia. This month, the British luxury goods manufacturer is the first in the industry to report results. Analysts’ estimates for retail sales growth range from 16.5% to 20.3%.
Threats
- Amazon has taken legal action against the European Union at Luxembourg’s General Court. The dispute concerns the Digital Services Act (DSA), which came into effect last year. Due to its extensive user base of over 45 million and 19 online platforms and search engines, Amazon falls under the category of very large online platforms (VLOP). This classification requires VLOPs to undertake additional measures to combat illegal online content. An Amazon representative stated, “If Amazon were labeled as a VLOP while other major retailers in the EU were not, it would be unfairly targeted and burdened with excessive administrative responsibilities that do not benefit EU consumers.”
- Bulgari, which is owned by Louis Vuitton, found itself in an uncomfortable situation when it failed to acknowledge Taiwan as a part of China in the store location description on its official website. China swiftly and strongly responded to this oversight, as luxury companies have faced similar backlash from China in the past. Bulgari promptly apologized and rectified the mistake.
- Burberry released its first quarter sales, which showed a significant 18% increase primarily driven by strong performance in the China region. However, amidst the robust sales in China, Burberry also experienced a notable 8% decline in revenue in the U.S. market. This decrease in demand poses a threat not only to Burberry but also to other luxury companies. The declining demand raises concerns about the company’s future and highlights the broader challenge faced by the luxury sector.

Energy and Natural Resources
Strengths
- The best performing commodity for the week was aluminum, rising 6.89%, along with other base metals with the continued sell off in the dollar this week. Defying the overall bearishness, the world’s oil demand likely grew 1.3 million barrels per day in the first quarter of 2023 and is projected to expand 2.2 million barrels per day in the second quarter. Absent a deep recession, global oil consumption will likely rise a solid 1.6 million barrels per day in 2023 to 101.45 million barrels per day—almost 300,000 barrels per day above consensus and a new record.
- According to Baker Hughes, the U.S. rig count increased to 680 this week. This marks a break from a nine-week decline and was driven by an increase in unconventional gas rigs to 122. Gas rigs increased mainly in the Permian, now up to 12, followed by the Haynesville, increasing to 46, and smaller shale plays now at 19.
- NextDecade Corp. is moving forward with an $18 billion group investment in the first phase of an LNG export facility to be built on the Texas coast. This is the third U.S. LNG proposal to reach a final investment decision this year. The project with ship to Europe and Asia starting in 2027.
Weaknesses
- The worst performing commodity for the week was natural gas, dropping 1.70%, marking its third weekly decline. Met coal prices decreased 5.5% week-per-week to $223 per ton. Met coal is down 2.6% over the past month and down 24.3% year-to-date. Met coal prices erased earlier gains, as soft August trade and weaker paper market values weighed on performance. On the supply side, shipments out of Queensland ports increased 5% week-over-week during the last week of Australia’s financial year-end busy season.
- EU gas demand fell by 13% year-over-year, 18% below the 2017-2021 average, due to depressed demand from power and industry. The pace of demand reduction should slow down on normal weather and some fuel switching back to gas. European gas demand may be down 4% year-over-year in 2023, down 16% versus 2021 levels. Europe is likely to exit winter 2023-2024 with storage levels like winter 2022/2023, at 56% full.
- U.S. spot steel prices resumed the downward trend following a slight/temporary rebound driven by a mid-June attempted price increase, with prices down 4.4% over the past two weeks to $860 per ton. Looking ahead, with lead times extending for the first time since mid-March, scrap prices potentially plateauing, and inventory at service centers remaining low, there is some potential for easing downward pressures in the near term.
Opportunities
- CEO Darren Woods of Exxon Mobil Corp. stated that the company is exploring opportunities to produce lithium that will be used in electric car batteries during an interview on CNBC, reported Bloomberg. Woods noted there is a lot of “natural synergy” between lithium mining and Exxon’s core skills. Woods is not far off the mark as there are companies considering direct lithium extraction from lithium bearing oil field brines in Canada’s oil patch.
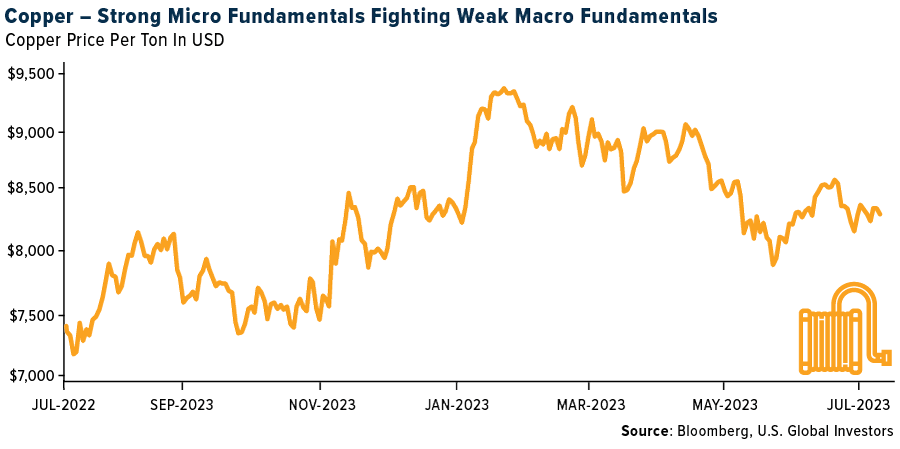
- Whilst the current macro environment for industrial metals remains oppressive, it is important to recognize that the copper economy continues to display significant out-performance in demand trends. In China, the majority consumer of the metal globally, apparent refined copper demand rose 11% year-over-year in the first half of 2023 and end demand was up 7% year-over-year through May. This realized onshore demand trend is substantially above consensus and reflects a combination of surging green demand and healthy growth in traditional drivers.
- Spending billions of dollars via its state-owned energy giants China National Petroleum Corp. (CNPC), China Petroleum & Chemical Corp. (Sinopec) and Cnooc Ltd., Beijing has been able to reverse the decline in domestic oil production that started in 2015, lifting output this year to a near all-time high. In
doing so, the country is somewhat dampening the need to buy crude overseas, complicating the efforts of Saudi Arabia and its OPEC+ allies to control the market.
Threats
- The U.S. National Centers for Environmental Information reported that the world had its hottest June ever for land and sea, with ocean temperatures setting new highs for the third month in a row. The news for July isn’t any better as it has seen the 10 hottest days ever recorded in heat waves spread across the planet. The extreme heat underscores the ever-increasing carbon emissions released from the burning of fossil fuels.
- Iron ore prices have been supported by China stimulus, but with shipments rising and more China steel production cuts coming through, prices are set to weaken, Morgan Stanley analysts including Amy Gower said in a note. The current strength is seen as “unsustainable,” and fundamentals are expected to take hold again, the bank said in a July 7 note, citing an “oversupplied market.” The bank sees a drop to $90 per ton in the fourth quarter.
- China’s exports fell 12.4 in dollar terms in June from a year earlier, reports Bloomberg. It marks the second monthly decline and was the biggest drop since the pandemic. China’s exports are driven by global demand and with the U.S. likely to hit a recession and with manufacturing already slowing down it will be hard to make a case for stronger growth in the second half of 2023.
Bitcoin and Digital Assets
Strengths
- Of the cryptocurrencies tracked by CoinMarketCap, the best performer for the week was XRP, rising 67.41%.
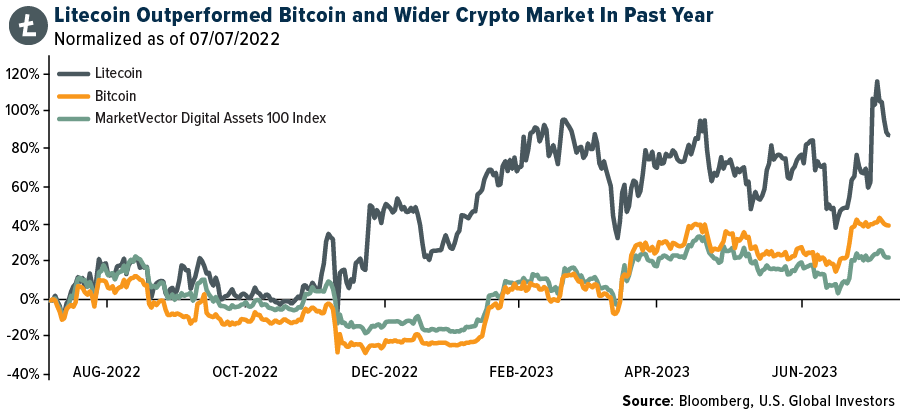
- Litecoin, over the past year, has outperformed the broader crypto market. One driver of the coin’s near-90% climb over the period was its so-called halving that will curb the supply of the token, a process that also lies ahead for Bitcoin in the coming months, writes Bloomberg.
- Coinbase shares roared more than 24% higher on Thursday in the wake of a judge’s ruling on a case involving cryptocurrency tokens. This is fueling debate on Wall Street over what the decision means for Coinbase’s own regulatory headaches, writes Bloomberg.
Weaknesses
- Of the cryptocurrencies tracked by CoinMarketCap, the worst performer for the week was eCash, down 19.44%.
- Dubai is reprimanding BitOasis, one of the largest crypto platforms focused on customers in the Middle East, for failing to meet mandated conditions set forth by the local regulator, writes Bloomberg.
- Argo Blockchain on Wednesday said bitcoin or bitcoin equivalents, mining production fell in June from May, due to network difficulties and issues at its mining facility in Texas, writes Bloomberg.
Opportunities
- Coinbase Global gained as much as 13% on Tuesday, trading at its highest intraday level since August and extending a rally driven by optimism over the potential U.S. approval of a Bitcoin ETF, writes Bloomberg.
- A federal judge ruled that the Ripple Labs token is a security when sold to institutional investors but not the general public, a long-awaited decision that was widely hailed as a victory for the crypto industry over the SEC, writes Bloomberg.
- Crypto-related crime has declined significantly, according to data from Chainalysis. A new report from the analytics firm notes that daily crypto inflows into illicit services is down relative to previous years, writes Bloomberg.
Threats
- U.S. prosecutors charged a New York man with stealing millions of dollars in crypto after exploiting vulnerabilities on a decentralized finance platform. Shakeeb Ahmed took advantage of a flaw in one of the exchange’s smart contracts to insert fake pricing data generating about $9 million of inflated and unearned fess that he was able to withdraw in crypto, writes Bloomberg.
- U.S. prosecutors charged a Moroccan man with stealing $450,000 in cryptocurrency and nonfungible tokens, including two Bored Apes, by creating a fake replica of the OpenSea digital marketplace in 2021, writes Bloomberg.
- The ex-Celsius CEO Alex Mashinsky was arrested on Thursday morning and charged with wire fraud and other crimes, according to Bloomberg. He has been accused by U.S. prosecutors of pumping up the price of his firm’s cryptocurrency to entice customers to the platform.

Gold Market
This week gold futures closed at $1,959.40, up $26.90 per ounce, or 1.39%. Gold stocks, as measured by the NYSE Arca Gold Miners Index, ended the week higher by 9.10%. The S&P/TSX Venture Index came in up 2.23%. The U.S. Trade-Weighted Dollar slumped 2.26%.
Strengths
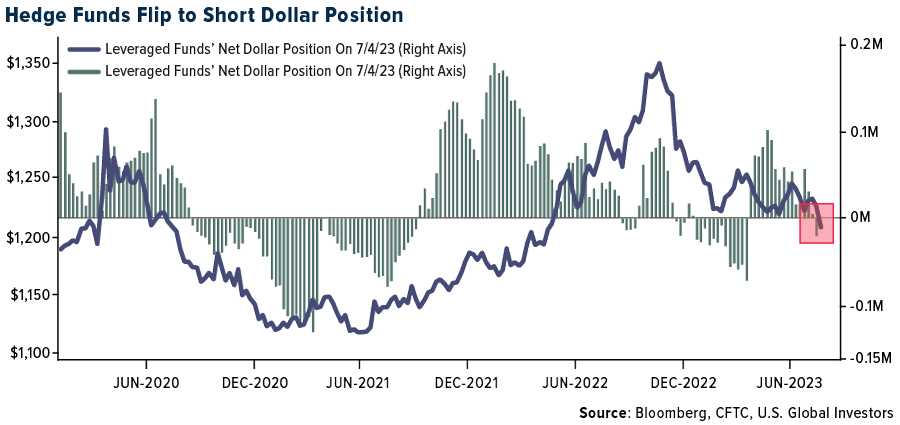
- The best performing precious metal for the week was silver, up 7.91%. This week’s softer economic data really gave precious metals a boost with rate expectations waning and the dollar sinking. This has prompted hedge funds to flip to net short on the U.S. dollar futures. Every G10 currency has strengthened against the greenback over the past month, reports Bloomberg. Ecuador’s central bank recently reported to have added $36.1 million of domestically produced gold to its reserves.
- K92 Mining announced that underground mining operations have resumed at its Kainantu mine in Papua New Guinea. K92 says that since the mine closure on June 28, which resulted from two fatalities on the underground incline, there has been limited impact on surface activities with surface stockpiles being treated through the processing plant. The company reported second-quarter production results of 30.8K gold ounces, above consensus of 26.1K ounces.
- Calibre Mining Corp said that its gold production rose 15% year-over-year to a record 68,776 ounces in the second quarter, marking the miner’s third consecutive record quarter. The company said that its year-to-date gold production rose 20% to a record 134,526 ounces.
Weaknesses
- The worst performing precious metal for the week was gold, but still up 1.39%. Data released by Rapaport shows that polished diamond prices further declined by 1-3% for 0.3ct to 3 carat stones in June. Polished inventory on RapNet remained high at 1.75 million carats on July 1, reflecting weak demand, as per Rapaport. Rough diamond producers including Petra Diamonds and Trans-Atlantic Gem Sales have already cancelled their June tenders while De Beers has its combining Cycle 5 and 6 auctions.
- Triple Flag Precious Metals reported second quarter GEO sales of 26.6K ounces and revenue of $52.6 million, versus consensus of 27.7K ounces and $55.1 million, respectively. The weaker performance versus consensus was on the silver side, where GEO sales were 8.2K ounces versus consensus of 11.4K ounces (28% weaker). This was offset mostly by stronger gold performance.
- Barrick Gold’s sales volumes were below consensus. Compared to Visible Alpha, second quarter gold sales volume of 1,001k ounces was 5% below the Street’s 1,051k ounces on implied cash costs of $966 per ounce versus the Street’s $921 per ounce. Barrick noted higher production at Carlin was offset by Cortez sequencing, Turquoise Ridge maintenance, and work related to Pueblo Viejo commissioning.
Opportunities
- A declining dollar is a positive trend for the gold outlook. The greenback is weakening as U.S. interest rates near a peak and the Federal Reserve’s aggressive tightening begins to take a toll on the world’s largest economy, investors say. That will set the stage for the likes of the yen, kiwi, and emerging-market currencies such as the Brazilian real and Colombian peso to strengthen, according to Alliance Bernstein and UBS Asset Management.
- Polyus PJSC plans to spend as much as 579 billion rubles ($6.32 billion) on buying back shares as Russia’s biggest gold miner prepares to delist from the London Stock Exchange. The board approved the repurchase starting Monday of as many as 40.8 million shares at 14,200 rubles a piece, the company said in a statement.
- According to CSFB, with headlines of Barrick’s interest in First Quantum and Endeavour Mining’s interest in Kinross’ Tasiast mine, along with Newmont’s definitive agreement to acquire Newcrest (deal closes in Q4-23), M&A remains in focus. The group continues to expect more M&A activity among the intermediate gold producers, to achieve scale, relevance, and stronger balance sheets to fund growth.
Threats
- The government of Mali is proposing to revamp its mining laws with a view to take an increased stake in the industry. Mining companies have always seeded a 10% stake to government, but now they would have the option to acquire another 20% versus the previous 10% cap. In addition, there is also a provision for another 5% for local investors. Mining licenses would be reduced to 10 years from 30 years. Mucahid Durmaz, West African analysts at Verisk Mapelcroft, noted such a change could normalize stricter state control and normalize interventionist polices, such as renegotiating mining contracts, impose export restrictions and introduce additional taxes.
- The Band of America commodities team now sees the silver price declining to a first quarter 2024 estimate average of $21.50 per ounce (versus spot at $23.09 per ounce), before rebounding. The prior forecast had silver rising to a peak price of $27.50 per ounce in the fourth quarter of 2023 before declining thereafter. Silver is forecast to remain well off the all-time closing high of $49.45 per ounce, set in January 1980. The dynamic for silver is seen differently than that for gold. The team expects silver will likely be supported by demand from solar panel and EV producers, but prices are unlikely to make meaningful headway until demand from traditional industrial sectors accelerates as the global economy bottoms out in 2024.
- CSFB anticipates a tough production quarter for Newmont due to the Penasquito strike (now in its fourth week) and the timing of sales at that mine. Penasquito production in the second quarter is now expected to be 9% of the mine’s 2023 guidance, versus 18% previously. This is also expected to negatively impact Wheaton Precious Metals’ silver deliveries from Penasquito in the second quarter.


U.S. Global Investors, Inc. is an investment adviser registered with the Securities and Exchange Commission (“SEC”). This does not mean that we are sponsored, recommended, or approved by the SEC, or that our abilities or qualifications in any respect have been passed upon by the SEC or any officer of the SEC.
This commentary should not be considered a solicitation or offering of any investment product. Certain materials in this commentary may contain dated information. The information provided was current at the time of publication. Some links above may be directed to third-party websites. U.S. Global Investors does not endorse all information supplied by these websites and is not responsible for their content. All opinions expressed and data provided are subject to change without notice. Some of these opinions may not be appropriate to every investor.
Holdings may change daily. Holdings are reported as of the most recent quarter-end. The following securities mentioned in the article were held by one or more accounts managed by U.S. Global Investors as of (06/30/2023):
Delta Air Lines
United Airlines
Airbus SE
JetBlue
American Airlines
Southwest Airlines
Alaska Air
Allegiant Travel
Frontier
Hawaiian
Sun Country
Boeing
Lucid Group Inc.
Mercedes
Volkswagen
BMW
Prada
Carnival Corporation
Kering
Burberry
Louis Vuitton
Exxon Mobile
K92 Mining
Triple Flag Precious Metals
Calibre Mining
Wheaton Precious Metals
*The above-mentioned indices are not total returns. These returns reflect simple appreciation only and do not reflect dividend reinvestment.
The Dow Jones Industrial Average is a price-weighted average of 30 blue chip stocks that are generally leaders in their industry. The S&P 500 Stock Index is a widely recognized capitalization-weighted index of 500 common stock prices in U.S. companies. The Nasdaq Composite Index is a capitalization-weighted index of all Nasdaq National Market and SmallCap stocks. The Russell 2000 Index® is a U.S. equity index measuring the performance of the 2,000 smallest companies in the Russell 3000®, a widely recognized small-cap index.
The Hang Seng Composite Index is a market capitalization-weighted index that comprises the top 200 companies listed on Stock Exchange of Hong Kong, based on average market cap for the 12 months. The Taiwan Stock Exchange Index is a capitalization-weighted index of all listed common shares traded on the Taiwan Stock Exchange. The Korea Stock Price Index is a capitalization-weighted index of all common shares and preferred shares on the Korean Stock Exchanges.
The Philadelphia Stock Exchange Gold and Silver Index (XAU) is a capitalization-weighted index that includes the leading companies involved in the mining of gold and silver. The U.S. Trade Weighted Dollar Index provides a general indication of the international value of the U.S. dollar. The S&P/TSX Canadian Gold Capped Sector Index is a modified capitalization-weighted index, whose equity weights are capped 25 percent and index constituents are derived from a subset stock pool of S&P/TSX Composite Index stocks. The NYSE Arca Gold Miners Index is a modified market capitalization weighted index comprised of publicly traded companies involved primarily in the mining for gold and silver. The S&P/TSX Venture Composite Index is a broad market indicator for the Canadian venture capital market. The index is market capitalization weighted and, at its inception, included 531 companies. A quarterly revision process is used to remove companies that comprise less than 0.05% of the weight of the index, and add companies whose weight, when included, will be greater than 0.05% of the index.
The S&P 500 Energy Index is a capitalization-weighted index that tracks the companies in the energy sector as a subset of the S&P 500. The S&P 500 Materials Index is a capitalization-weighted index that tracks the companies in the material sector as a subset of the S&P 500. The S&P 500 Financials Index is a capitalization-weighted index. The index was developed with a base level of 10 for the 1941-43 base period. The S&P 500 Industrials Index is a Materials Index is a capitalization-weighted index that tracks the companies in the industrial sector as a subset of the S&P 500. The S&P 500 Consumer Discretionary Index is a capitalization-weighted index that tracks the companies in the consumer discretionary sector as a subset of the S&P 500. The S&P 500 Information Technology Index is a capitalization-weighted index that tracks the companies in the information technology sector as a subset of the S&P 500. The S&P 500 Consumer Staples Index is a Materials Index is a capitalization-weighted index that tracks the companies in the consumer staples sector as a subset of the S&P 500. The S&P 500 Utilities Index is a capitalization-weighted index that tracks the companies in the utilities sector as a subset of the S&P 500. The S&P 500 Healthcare Index is a capitalization-weighted index that tracks the companies in the healthcare sector as a subset of the S&P 500. The S&P 500 Telecom Index is a Materials Index is a capitalization-weighted index that tracks the companies in the telecom sector as a subset of the S&P 500.
The Consumer Price Index (CPI) is one of the most widely recognized price measures for tracking the price of a market basket of goods and services purchased by individuals. The weights of components are based on consumer spending patterns. The Purchasing Manager’s Index is an indicator of the economic health of the manufacturing sector. The PMI index is based on five major indicators: new orders, inventory levels, production, supplier deliveries and the employment environment. Gross domestic product (GDP) is the monetary value of all the finished goods and services produced within a country’s borders in a specific time period, though GDP is usually calculated on an annual basis. It includes all private and public consumption, government outlays, investments and exports less imports that occur within a defined territory.
The S&P Global Luxury Index is comprised of 80 of the largest publicly traded companies engaged in the production or distribution of luxury goods or the provision of luxury services that meet specific investibility requirements.
The Bloomberg Dollar Spot Index tracks the performance of a basket of 10 leading global currencies versus the U.S. Dollar.