

Here’s How Investors Can Potentially Tame September Volatility
September has historically been one of the worst months for stocks, with returns averaging -0.34% for the 30-year period, -0.26% for the 15-year period and -0.92% for the five-year period, according to Bloomberg data. As you can see below, September is the only month when the market was down on average in every time period.
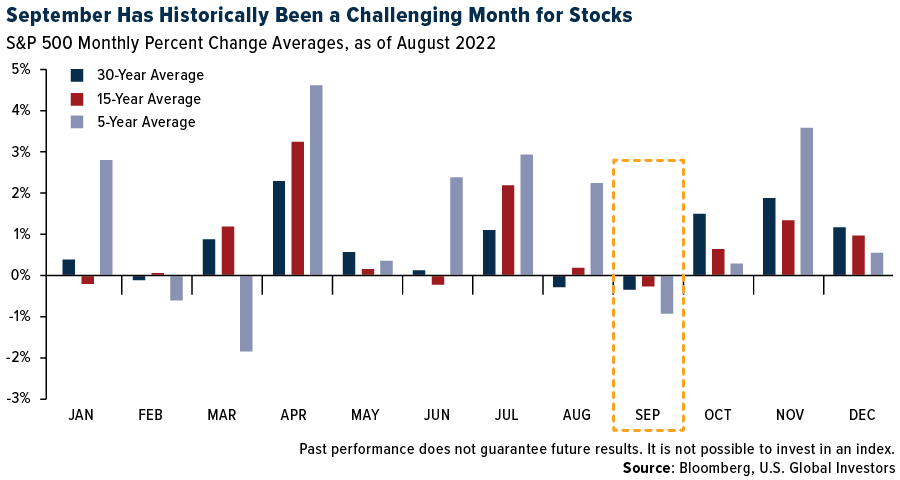
This, coupled with the fact that 2022 has already been a highly volatile year due to scorching inflation, rising interest rates, recessionary fears and a persistent war in Ukraine, means that investors may consider seeking a haven for their wealth. At the moment, cash appears to be king, with the U.S. dollar’s value at a 20-year high.
Loyal readers know I also prefer gold and high-quality gold mining stocks, which I believe should make up no more than 10% of a conservative investor’s portfolio. Investors with a longer time horizon may consider between a 2% and 5% weighting in Bitcoin, which looks attractive now at around $20,000.
Two Additional Risks: The Fed and Midterm Elections
There are two additional macro risks that will make this September particularly interesting. The first is the Federal Reserve’s more aggressive stance against inflation. At this year’s Jackson Hole Economic Symposium, Fed Chair Jerome Powell admitted that rates will likely stay higher for longer to slow growth, which “will also bring some pain to households and businesses.”
Some market watchers and analysts translate Powell’s words to mean that he is no longer interested in a soft landing. Instead, he may be seeking what economists call a “growth recession,” defined loosely as a period during which the economy is growing at such a slow pace that more jobs are being lost than added.
We’re not there yet, though August’s jobs report, released last Friday, could arguably be indicating a slowdown. An estimated 315,000 payrolls were added during the month, slightly exceeding some economists’ expectations but down significantly from July’s 526,000 jobs added.
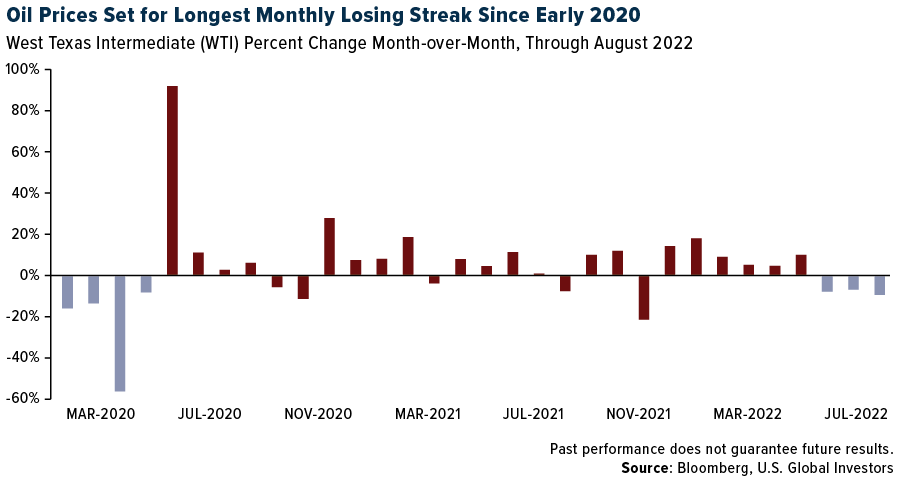
Another indicator that the economy may be slowing? Lower oil prices. The price of West Texas Intermediate (WTI) crude fell for the third straight month in August, its longest losing streak since the beginning months of the pandemic in 2020. Just as it did then, oil could be telling us that global demand is slipping.
The second risk is the upcoming midterm elections. Market volatility has tended to be higher in advance of the November midterms, which are largely seen as a referendum on the incumbent president’s policies.
Historically, the political party in charge of the White House has lost seats in Congress during the first round of midterm elections. Notably, Democrats lost a whopping 63 seats in 2010, prompting then-President Barack Obama to call the defeat a “shellacking.” The most recent exception to the rule came in 2002 when Republicans picked up eight additional seats, suggesting Americans approved of President George W. Bush’s job as chief executive and commander-in-chief, particularly following the 9/11 attacks.
I decline to make any predictions on this year’s midterm elections, other than to say that the most favorable outcome may be a divided Congress. History shows that stocks have generally performed better when a Democrat was in the Oval Office but the U.S. House and Senate were split (though, admittedly, this arrangement has occurred far less frequently than others over the past 90 years).
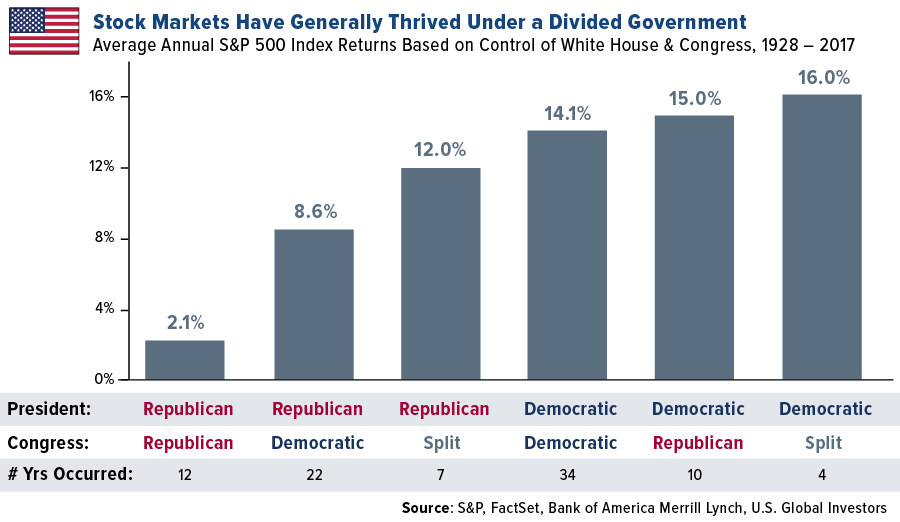
In short, investors seem to prefer legislative gridlock. The day after the midterm elections in 2018, which saw the Democrats take control of the House and Republicans remain in control of the Senate, the S&P 500 jumped more than 2%.
Focus on the Policies, Not the Parties
As a reminder, we at U.S. Global Investors have no preference when it comes to political parties. It’s the policies that matter, and we believe there’s money to be made if you ignore the noise and follow the trendlines, not the headlines.
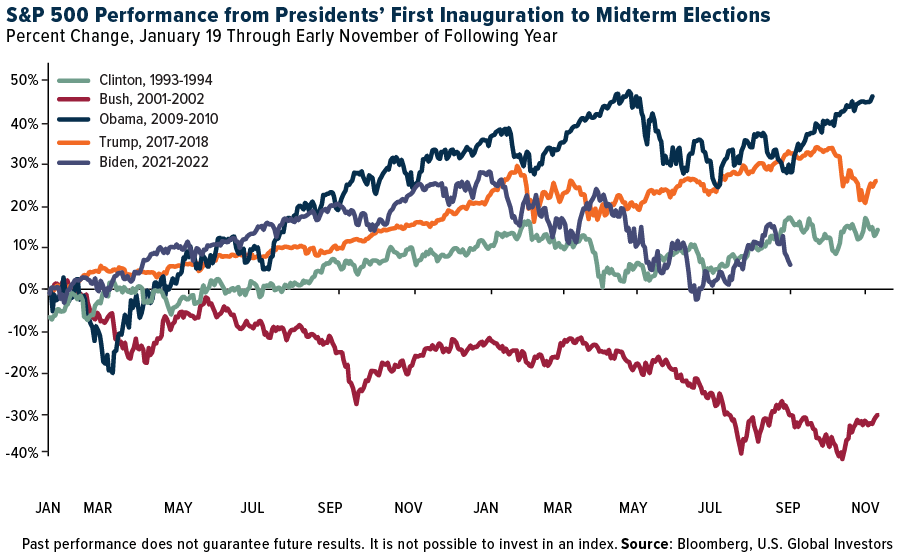
Below is the S&P 500’s performance from the start of each new presidency going back 30 years to the November midterm elections. Except for the second half of President Joe Biden’s term so far, and all of Bush’s first term—which had a series of unique challenges, including the remnants of the dotcom bubble, the Enron scandal and 9/11—stocks have generally headed higher no matter which party held the White House.
Fortune Favors the Patient?
Here’s another way to look at it: The market has been up three out of every four years going all the way back to 1926. If your portfolio is down for the year right now, as it is for most investors, it may make sense statistically to put it out of mind for the time being instead of selling at a loss.
This strategy has worked well over a longer timeframe. For the past 84 years, selling S&P 500 stocks after holding them for 10 years has led to a realized loss in only three main instances: the late 1930s (due to the Great Depression and World War II), the mid- to late-1970s and early 1980s (due to oil shocks and high inflation) and the 2008-2009 financial crisis. In all other cases, holding stocks for 10 years or longer has been a profitable action; on average, investors doubled their investment. Today, the market is down about 12% over the past 12 months, but over the past 10 years, it’s up 240%.
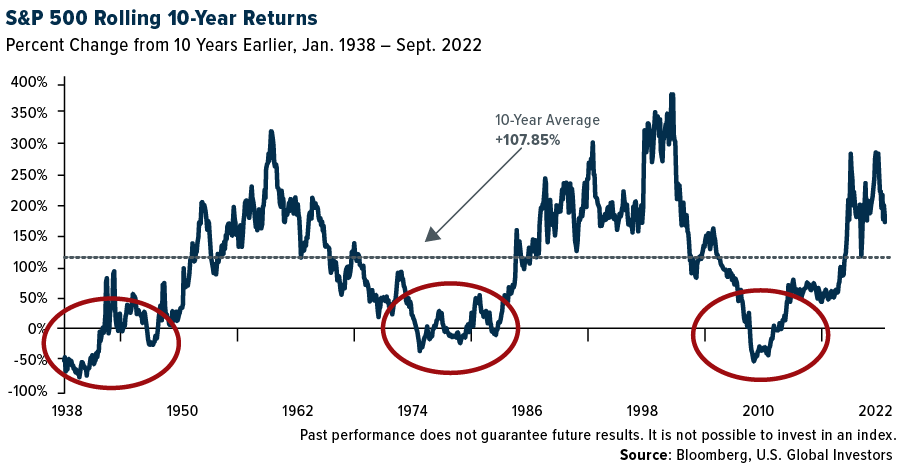
Not everyone has 10 years to make back their money, of course, which is part of the reason why I like to recommend gold. Gold was one of the few bright spots in the first half of 2022, helping investors mitigate losses in equities and bonds during an exceptionally volatile year.
U.S Global Investors (NASDAQ: GROW) reported operating income of $11.1 million, a 36% increase year-over-year, and an operating margin of 45% for the fiscal year ended June 30. Get all the details by reading the press release, found here.
All opinions expressed and data provided are subject to change without notice. Some of these opinions may not be appropriate to every investor. By clicking the link(s) above, you will be directed to a third-party website(s). U.S. Global Investors does not endorse all information supplied by this/these website(s) and is not responsible for its/their content.
The S&P 500 is widely regarded as the best single gauge of large-cap U.S. equities and serves as the foundation for a wide range of investment products. The index includes 500 leading companies and captures approximately 80% coverage of available market capitalization.


