For the First Time in 20 Years, 1 Dollar = 1 Euro. What this Means for Gold
If you were considering taking the family on a European vacation, now may be a good time, as the U.S. dollar and euro just achieved parity for the first time in 20 years.
But as someone who was recently in Europe, I urge travelers to be aware that prices have skyrocketed everywhere, not just in the U.S. A five-star hotel in France or Italy that might have cost $350 a night before the pandemic can now cost as much as $1,600.
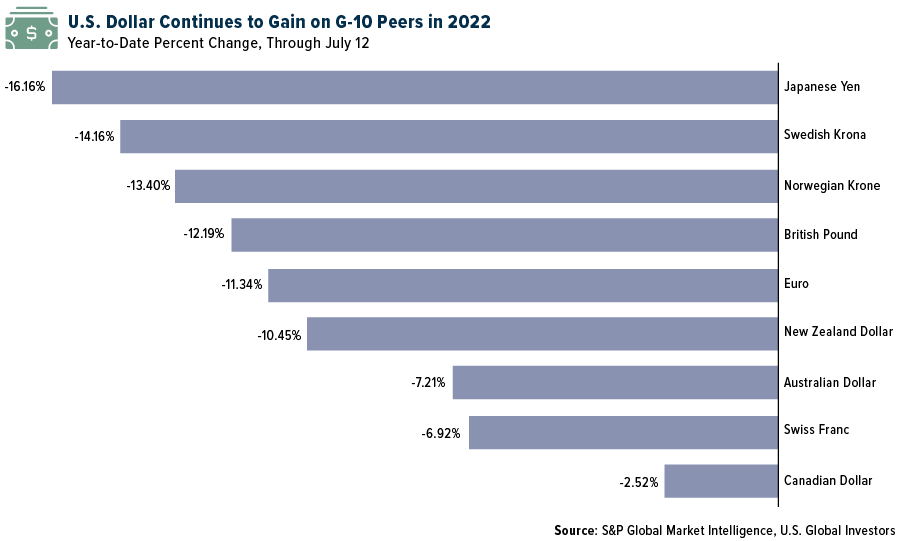
Much is being made about the USD/EUR exchange rate, but the truth is that King Dollar has made epic gains on a number of world currencies this year as the U.S. has embarked on an aggressive monetary tightening cycle to control inflation. Below you can see how much G-10 currencies have fallen in 2022 compared to the greenback.
A stronger dollar is favorable not only for Americans traveling abroad but also companies that pay to import goods from other countries—think big-box retailers such as Walmart, Target, Home Depot and Dollar Tree.
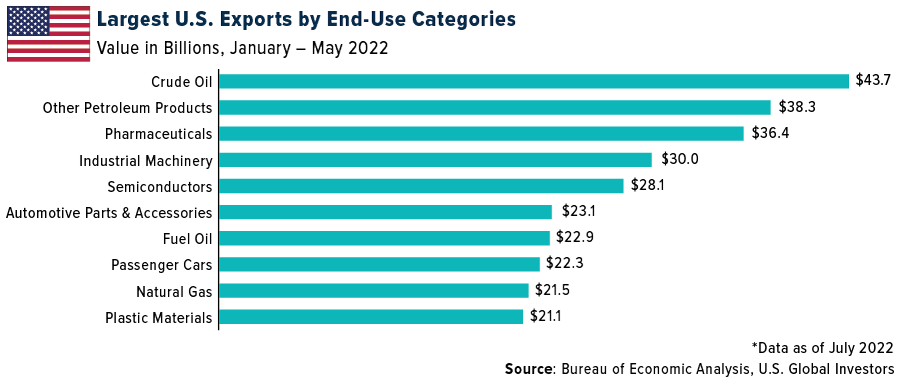
On the other hand, a soaring dollar can hurt U.S. exporters since it makes goods more expensive to foreign buyers, dampening demand. Between January and May of this year, the top U.S. exports by end-use included crude oil and petroleum products, mostly due to the massive increase in crude prices. Other top exports included pharmaceuticals, industrial machinery, semiconductors, automotive parts and accessories, fuel oil, automobiles, natural gas and plastic materials, according to Bureau of Economic Analysis (BEA) data.
Boeing Reports Best Month for Deliveries Since 2019
The single largest U.S. exporter in value terms is Boeing. The massive aerospace company, which recently moved its headquarters to Arlington, Virginia, faced a wave of order cancellations stemming from the tragic 2018/2019 crashes involving the 737 MAX, but orders look to be picking up again. As I shared with you last week, Boeing reported stellar delivery results for the second quarter, with 51 aircraft delivered in June alone. That’s the company’s best month since March 2019.
I will be curious to see if Boeing executives address the impact of the stronger dollar when the company reports second-quarter financial results later this month.
King Dollar Pushes Gold Deep into Oversold Territory
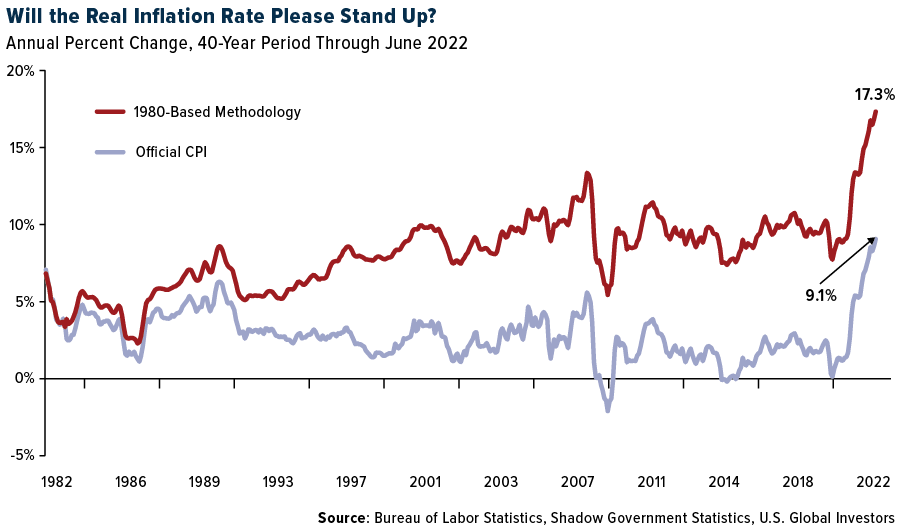
Among the biggest victims of King Dollar’s strength is gold, which, like most commodities, is priced in the greenback internationally. The yellow metal has long been valued as a safe haven during times of economic uncertainty and high inflation, which we’re certainly facing today. June’s consumer price index (CPI) came in at a scorching annual rate of 9.1%, the highest in over 40 years, but if we use the inflation methodology from 1980, the figure is closer to 17% or more.
Despite this, gold has steadily fallen since its 2022 high of $2,070 per ounce, set in early March. As of today, gold is off close to 7% for the year, and last week it briefly traded below $1,700 for the first time since March 2021. Based on the 14-day relative strength index (RSI), the metal looks incredibly oversold at around 23, the lowest it’s been since August 2018.
In addition, gold has signaled a “death cross,” which occurs when the 50-day moving average dips below the 200-day moving average.
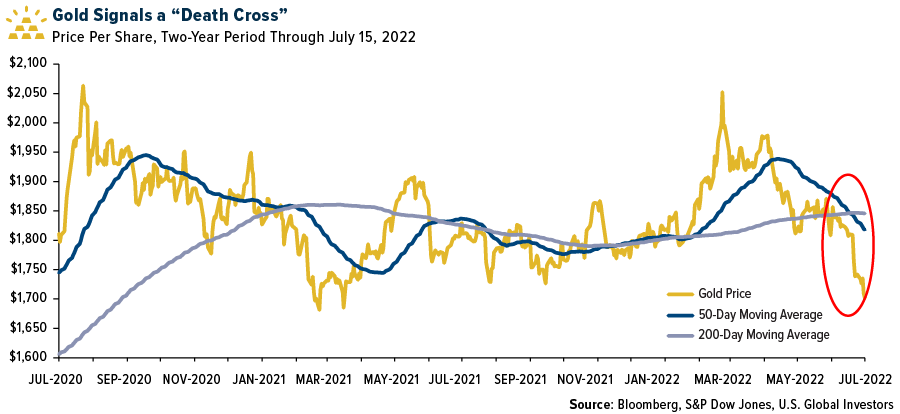
Some investors and traders see this move as a bearish sign. I see it as a buying opportunity. If you believe that the dollar is overextended relative to other currencies, and that a reversal could happen in the coming weeks and months, now may be a good time to accumulate, especially if you think we’re in the midst of a recession.
Deepest Yield Inversion Since 2000
I’ve shared with you a couple of times that we may very well be in a recession already, based on the Atlanta Federal Reserve’s GDPNow real-time forecast. The latest forecast, as of last Friday, is that the U.S. economy contracted 1.5% in the second quarter, following an annual decrease of 1.6% in the first quarter.
Even if that ends up not being the case, the bond market is telling us that a pullback may be imminent.
A yield inversion occurs when the shorter-term Treasury bond trades with a higher yield than the longer-term Treasury. Remember, bond yields go up when prices go down, so when yields invert, it suggests that investors find shorter government notes riskier to hold than longer-dated ones.
Inversions have been extraordinarily accurate at predicting recessions. Going back at least 40 years, every recession has been preceded by an inverted yield curve, using the two-year and 10-year Treasuries.
Not only is the yield curve inverted right now, but it’s inverted at the biggest point since the year 2000, soon before the dotcom bubble burst.
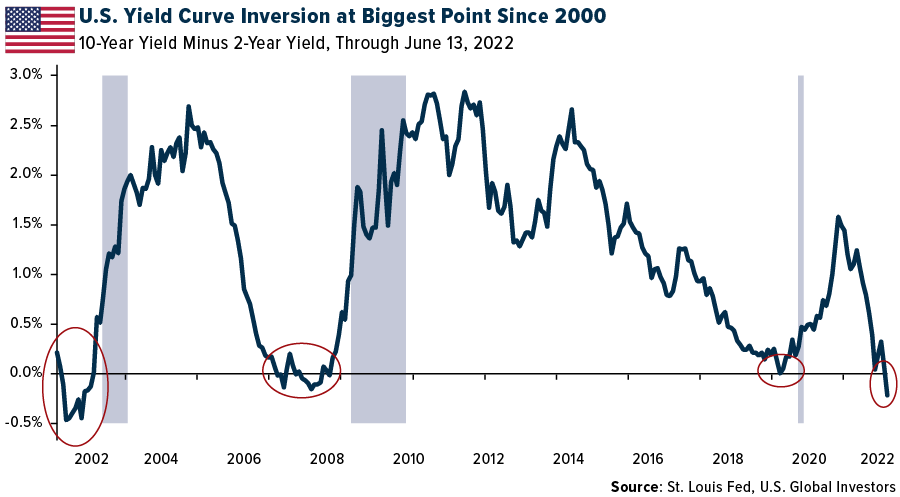
So what does this mean? Past performance is no guarantee of future results, but we could be looking at a pullback, if not this year then the next. More specifically, stocks and other risk assets may not have found a bottom yet. From its all-time high in early January, the S&P 500 has fallen 20%, but historically it’s dropped as much as 35% on average when a bear market coincides with a recession.
Do with that information as you wish, but I believe it’s wise and prudent to have exposure to gold at this time, between 5% and 10% of your portfolio.
Have you seen the Seeking Alpha article on GROW yet? Click here to read “U.S. Global Investors: 53% Margin of Safety Implied”!
All opinions expressed and data provided are subject to change without notice. Some of these opinions may not be appropriate to every investor. By clicking the link(s) above, you will be directed to a third-party website(s). U.S. Global Investors does not endorse all information supplied by this/these website(s) and is not responsible for its/their content.
The S&P 500 is a stock market index tracking the stock performance of 500 large companies listed on exchanges in the United States. The Consumer Price Index measures the overall change in consumer prices based on a representative basket of goods and services over time. The relative strength index is a technical indicator used in the analysis of financial markets. It is intended to chart the current and historical strength or weakness of a stock or market based on the closing prices of a recent trading period.
Holdings may change daily. Holdings are reported as of the most recent quarter-end. The following securities mentioned in the article were held by one or more accounts managed by U.S. Global Investors as of (06/30/22): The Boeing Co.


