


Frank Talk
Economic Indicators Are Flashing Mixed Signals Amid Recession Speculation
Date Posted: August 5, 2024
Read time: 7 min
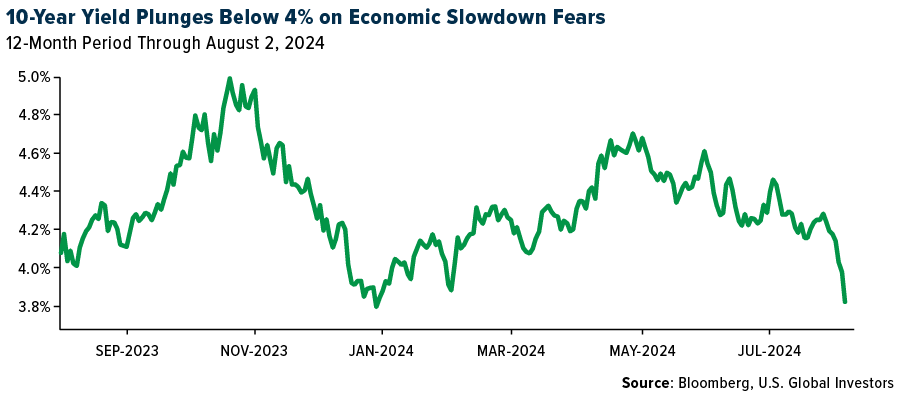
As I write this, the yield on the 10-year Treasury has fallen below 3.8% as global markets tumble on growing recession fears. Investors rushed into the perceived safety of government debt after Friday’s weak jobs report and slowdown in global manufacturing activity.
Manufacturers in the U.S. have taken their foot off the accelerator and are applying pressure to the brake. Both major indices that measure the strength of the U.S. manufacturing sector show that it contracted last month. Surveyed companies told the Institute of Supply Management (ISM) that demand was subdued “due to current federal monetary policy and other conditions,” while S&P Global found that new business shrank at the fastest pace so far this year.
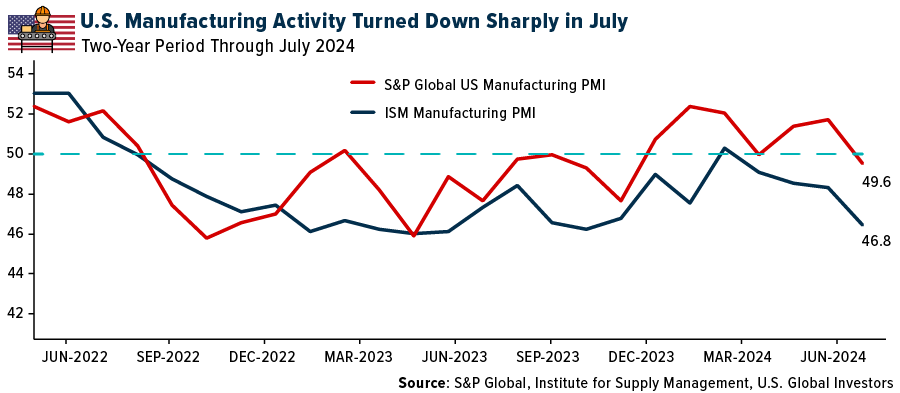
The JPMorgan Global Manufacturing PMI also also entered contraction territory in July, registering a 49.7 and dipping below its three-month moving average.
Sahm Rule in Effect
But wait, there’s more…
The unemployment rate ticked up to 4.3%, triggering the Sahm Rule, an indicator that—when applied to historical data—has accurately signaled nearly every U.S. recession since the 1950s. Named for Federal Reserve economist Claudia Sahm, the indicator says that a recession is imminent, or we’re already in one, if the unemployment rate’s three-month moving average rises half a percentage point or more (+0.50%) from its low the previous year.
Following Friday’s jobs report, the Sahm Rule hit 0.53%.
Are Recession Indicators Flashing False Positives?
So what happens now?
Only time will tell if we’re truly facing the start of the long-awaited recession, but it’s worth pointing out that other closely watched recession indicators have not been very dependable this cycle. Those include the New York Fed’s recession probability indicator and the Conference Board’s Leading Economic Index.
Remember the inverted yield curve? A year and a half ago, I shared with you that the spread between the 10-year yield and two-year yield was at its most extreme in 40 years. This suggested that a slowdown was “all but guaranteed,” I wrote then.
Historically, the average time between an inverted yield curve and a recession is 12 to 24 months. The current inversion was first observed on March 31, 2022, far more than 24 months ago, so either the pullback is delayed or we’re looking at a false positive.
Is the Sahm Rule also flashing a false positive? Again, no one can say for certain, but I believe last week’s poor economic data suggests that we’ll get a much-needed rate cut when the Federal Open Market Committee (FOMC) meets next month.
Economic uncertainty is one of the top reasons why I’ve always recommended gold as a portfolio diversifier. I prefer to have about 10% of my assets in gold, with half of it in physical bullion (coins, bars and jewelry) and the other half in high-quality gold mining stocks and ETFs.
Gold Analyst Believes China’s Central Bank Continues to Buy Gold
Total gold demand reached its highest second quarter on record this year, according to the most recent report by the World Gold Council (WGC). Global demand for the yellow metal touched 1,258 tonnes in the June quarter, up a marginal 4% from the same period last year but marking the highest second-quarter figure ever in the WGC’s data going back to 2000.
Gold investment was essentially flat from last year, but record prices weighed heavily on jewelry sales during the quarter. Worldwide consumption of gold jewelry dropped sharply to 391 tonnes, a 19% decrease year-over-year. Sales slumped a significant 35% in China, whose residents have cut back on expensive purchases such as precious metals and luxury goods.
Speaking of gold and China, you may have seen headlines stating that the central bank of the world’s second-largest economy was stepping back from its epic gold-buying spree.
Those headlines may not be entirely accurate, based on new analysis.
In a new report, famed gold analyst Jan Nieuwenheijs says that he believes China has, on the contrary, secretly continued to import bullion. According to his analysis of customs data, Nieuwenheijs concludes that the People’s Bank of China (PBoC) has been buying 400-ounce bars from the U.K., even though it’s been claiming the exact opposite.
If true, this is very bullish for gold demand. I encourage you to check out Nieuwenheijs’s article, which you can find here.
Gold Shines Bright at the Olympics
On a final note, many of you watching this year’s Olympics Games may have noticed the unique, hexagon-shaped medals. They are indeed unique, designed by LVMH-owned fashion brand Chaumet, marking the first time in Olympic history that a jeweler was put in charge of designing the medals.
It’s for this reason, and the fact that the medals contain an iron piece of the Eiffel Tower, that Oxford Economics says it believes “winning an Olympic medal this year should yield considerable investment value.”
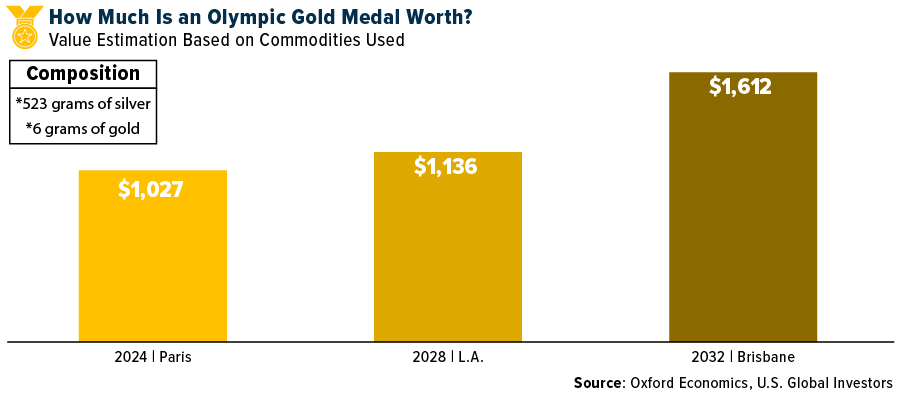
An Olympic gold medal is priceless, of course, and therefore more valuable than the basic materials that went into making it—523 grams of silver, covered in six grams of gold. But if we’re pricing a gold medal based just on today’s commodity prices, it’s valued around $1,027, according to Oxford. Forecasters there say that the same medal could be worth $1,136 in 2028, when the Olympics takes place in Los Angeles, and $1,612 in 2032, just in time for the Brisbane Games.
The S&P Global US Manufacturing PMI (Purchasing Managers’ Index) is a monthly survey that measures the activity of purchasing managers in the US manufacturing sector. The ISM Manufacturing Index (PMI), also known as the Purchasing Managers’ Index, is a monthly survey of purchasing managers at manufacturing companies in the United States that indicates the state of the economy. The J.P. Morgan Global Manufacturing PMI (Purchasing Managers’ Index) is a monthly survey of purchasing executives from 32 of the world’s leading economies that provides an overview of the global manufacturing sector. The Federal Reserve Bank of New York’s recession probability indicator uses the slope of the yield curve, or “term spread,” to calculate the likelihood of a recession in the United States in 12 months. The Conference Board’s Leading Economic Index (LEI) is a composite index of 10 indicators that tracks economic activity in the United States.
Past performance does not guarantee future results. All opinions expressed and data provided are subject to change without notice. Some of these opinions may not be appropriate to every investor. By clicking the link(s) above, you will be directed to a third-party website(s). U.S. Global Investors does not endorse all information supplied by this/these website(s) and is not responsible for its/their content.