Don’t Miss This Golden Cross in Resources
Press Release:
U.S. Global Investors Earned 11 Investor Education Awards from the MFEA
U.S. Global Investors Announces Earnings Webcast
By Frank Holmes
CEO and Chief Investment Officer
U.S. Global Investors
While investors have been focusing on the strengthening U.S. market, we’ve also kept our eyes on other improving indicators happening in resources, Europe, and emerging markets. These places may not be as widely popular, but we believe investors can benefit greatly from taking a view that’s different from the ones observed by the majority.
No one would disagree that Warren Buffett, a famous contrarian, has been very successful by going against the herd.
A key is in identifying strengths early and using math in your favor. We’ve discussed many of these patterns before:
- Don’t Sell in May: Here are Reasons to Extend Your Stay
- Is Europe Ready to Take Off?
- Two Charts Illustrate How to “Follow the Money”
- 5 China Charts That Look Bullish for Commodities
- Trying to Stop a Bull Market Has Risks
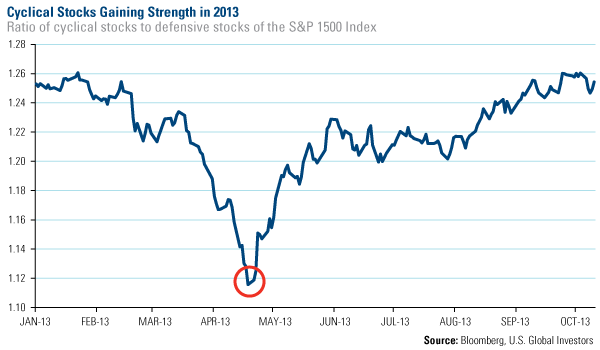
Consider the leadership change in stocks that took place earlier this year. During the last week in April, you’ll recall that U.S. equities bounced back after suffering the worst losses of the year in the previous week, with certain companies taking the lead. Here were our observations from the week’s performance:
“Cyclicals rose this week and noncyclical areas were the laggards, which is a change from recent trends. We potentially could be at an inflection point, as defensive areas such as telecom, staples, healthcare and utilities have outperformed by a wide margin in recent months and mean reversion may kick in as expectations got too lofty for defensives and too gloomy for cyclicals.”
The chart below shows this turn in the market. Until April 23, cyclical sectors were losing strength against defensive areas. Since then, cyclical stocks have been gaining strength and while the path has experienced the occasional stumble, there’s clearly a rising trend. Cyclical companies in sectors such as information technology, industrial, materials and consumer discretionary tend to sell goods and services beyond the basic needs. These are the goods and services businesses and consumers buy when times are good.
Also consider China’s government manufacturing purchasing manager’s index (PMI), which rose for the third month in a row in October. Earlier this year, the survey sample was enlarged from 820 to 3,000 companies, so this PMI is generally a good indicator of China’s overall demand.
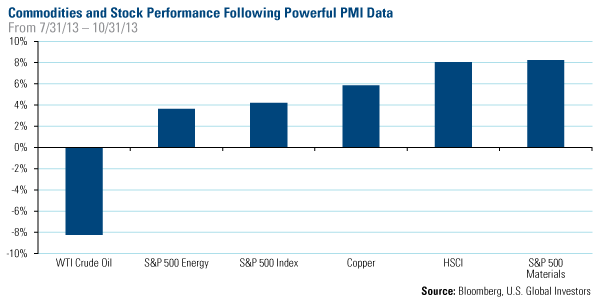
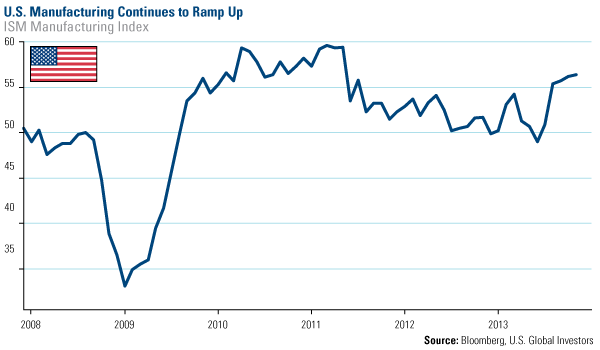
We closely follow PMIs because they provide a measure of well-being for the manufacturing sector and the economy as a whole. A number above 50 represents expansion, but what’s more important for investors is to pay attention to the close relationship between the trend in PMIs and the resulting performance of commodities and stocks.
It’s a historical fact that in the three months following a “cross above,” there was about a 65 percent probability that commodities and stocks would rise in value.
And taking a look at performance from July 31 through October 31 of this year, you can see the trend held for all measures, except for WTI crude oil. Materials stocks in the S&P 500 Index increased the most, rising more than 8 percent, closely followed by the Hang Seng Composite Index.
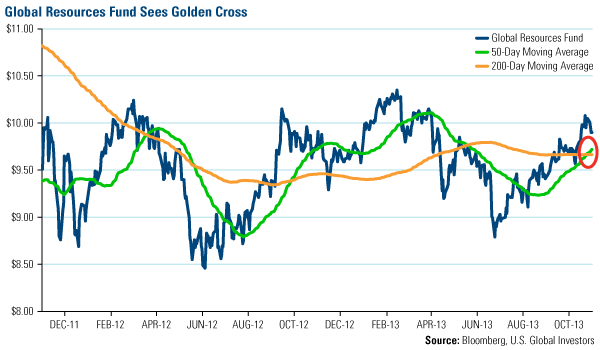
We believe the strength in these areas of the market is encouraging for the Global Resources Fund (PSPFX). What’s more positive is the fact that the fund recently hit a “golden cross.” This technical signal, formed when the short-term 50-day moving average crosses above the longer-term 200-day moving average, is interpreted by many traders and investors as bullish.
This may be because the “golden cross” has strong historical backing. Going back 20 years, the fund experienced very few whipsaws as these “golden crosses” occurred only 13 times prior to the latest crossing. And taking a look at the performance from each “golden cross” to its peak, the Global Resources Fund rallied an average of 40 percent in the following 271 calendar days after a “golden cross” occurred.
See the recent performance of the fund.
We believe great value in today’s energy market lies in selectively choosing companies that own high-quality assets in the core basin areas of Eagle Ford, Permian, Marcellus and Bakken. What’s important to our process is finding oil and gas companies that are growing their reserves, production and cash flows on a per share basis.
In An American Energy Revolution, we mentioned Pioneer Natural Resources (PXD), the oil and gas company based in Irving, Texas, which has key assets in Eagle Ford shale and Permian Basin. Often discussed as an acquisition target by a major oil company, it has been a large holding for the Global Resources Fund. On a year-to-date basis, the stock has increased 92.6 percent.
There’s also Enterprise Products Partners (EPD), which is a midstream MLP with a dividend yield of 4.4 percent. Based in Houston, it’s one of the biggest and most successful MLPs over the last decade. It dominates the processing, transportation and storage of natural gas liquids, which is growing rapidly from the rapid development of U.S. and Canadian oil & gas shale plays. MLPs is one significant emerging energy theme the fund managers have been capitalizing on and on a year-to-date basis, EPD has increased 32 percent.
Valero Corp (VLO) is another Texas-based stock in the energy space. Valero is the largest independent refiner in the U.S., with operations in Canada and Europe. Cheap natural gas and discounted oil from shale and oil sands give Valero a competitive edge compared to its global peers. In addition, its complex Gulf Coast refineries are exporting record fuel volumes to rapidly growing emerging markets. VLO has rewarded investors with a 33 percent return, year-to-date.
With potentially greater returns from energy companies combined with a high probability that the fund will continue to climb because of its “golden cross,” a major difference between an investor gaining from the opportunity or missing it is in taking action today.
Index Summary
- Major market indices finished higher this week. The Dow Jones Industrial Average rose 0.29 percent. The S&P 500 Stock Index gained 0.11 percent, while the Nasdaq Composite fell 0.54 percent. The Russell 2000 small capitalization index dropped 2.03 percent this week.
- The Hang Seng Composite rose 2.28 percent; Taiwan advanced 0.50 percent while the KOSPI inched ahead 0.25 percent.
- The 10-year Treasury bond yield rose 11 basis points this week to 2.62 percent.
Domestic Equity Market
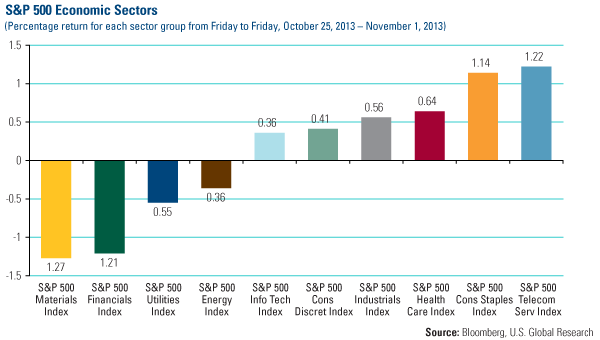
The S&P 500 eked out a new high this week as defensive areas of the market reasserted themselves. The telecom, staples and healthcare sectors led the way, while materials and financials were the big relative losers this week.
Strengths
- The telecom service sector was the best performer this week as AT&T rose nearly 3 percent on speculation of a potential acquisition of Vodafone.
- The consumer staples sector also rallied as tobacco and drugstore companies posted good performance this week.
- J.C. Penney was the best performer in the S&P 500 this week rising 19.88 percent. Comparable store sales were down 4 percent versus expectations of a 6 percent drop, and third quarter revenue estimates increased modestly.
Weaknesses
- The materials sector was the worst performing group this week with mixed performance. MeadWestvaco fell by more than 10 percent on news that the company is selling a net $1.1 billion in timberland assets to Plum Creek Timber.
- The financial sector also lagged as real estate investment trusts generally fell, led by Plum Creek Timber.
- Avon Products was the worst performer in the S&P 500 this week, falling 16.92 percent. The company fell after posting disappointing earnings along with an announcement that government fines related to foreign bribery investigations may materially impact earnings.
Opportunity
- The current macro environment continues to be positive as economic data remains robust enough to give investors confidence in an economic recovery, but not too strong as to force the Federal Reserve to change course in the near term.
- Money flows are likely to find their way into domestic U.S. equities and out of bonds and emerging markets.
- The improving macro backdrop out of Europe and China could be the catalyst for a rally into year end.
Threat
- A market consolidation could occur in the near term after such a strong year.
- Higher interest rates are a threat for the whole economy. The Fed must walk a fine line and the potential for policy error is large.
- The debt ceiling and government shutdown have passed, but the economic fallout will likely be felt over the next weeks and months as they negatively affect upcoming economic data releases.
Readers like you know the value of insight from the experts. How can you take advantage of the insights that Frank Holmes offers? Don’t miss out on his CEO blog, Frank Talk. It’s one of the best places to learn about opportunities you don’t want to miss in emerging Europe, resources, and more. Get instant access when you sign up for Frank Talk today.
Near-Term Tax Free Fund – NEARX • Tax Free Fund – USUTX
The Economy and Bond Market
Treasury bond yields rose this week on better economic data along with a modest shift in expectations on the timing of quantitative easing tapering. Expectations for tapering were centered around March 2014, but with the statement from the Federal Open Markets Committee (FOMC) meeting this week, some believe tapering could occur as soon as December.
Strengths
- The ISM Purchasing Managers Index rose more than expected in October, reaching its highest level since April 2011.
- Industrial production in September was also better than expected, rising 0.6 percent.
- Chinese manufacturing PMI came in ahead of expectations, hitting the highest level since May 2011.
Weaknesses
- September retail sales were modestly weaker than expected and actually declined by 0.1 percent month-over-month.
- Consumer confidence fell sharply in October, with the government shutdown playing a significant role. Consumer confidence hit a six-month low.
- The rollout of Obamacare has produced quite a bit of negative publicity and is yet another factor weighing on investors’ confidence.
Opportunity
- Despite recent conflicting commentary, the Fed continues to remain committed to an overall accommodative policy and is unlikely to raise interest rates in 2013 or early 2014.
- Key global central bankers remain in easing mode such as the European Central Bank (ECB), Bank of England and the Bank of Japan.
- The government shutdown damage is probably done and may push QE tapering into mid-2014.
Threat
- Inflation in some corners of the globe is getting the attention of policy makers and may be an early indicator for the rest of the world.
- Trade and/or currency “wars” cannot be ruled out which may cause unintended consequences and volatility in the financial markets.
- The recent bond market sell off may be a “shot across the bow” as the markets reassess the changing macro dynamics.
World Precious Minerals Fund – UNWPX • Gold and Precious Metals Fund – USERX
Gold Market
For the week, spot gold closed at $1,316.20, down $34.6 per ounce, or 2.56 percent. Gold stocks, as measured by the NYSE Arca Gold Miners Index, lost 8.15 percent. The U.S. Trade-Weighted Dollar Index gained 1.91 percent for the week.
Strengths
- This week, Eldorado Gold announced the friendly acquisition of Glory Resources. Glory is focused on advancing the high-grade Sapes project, located about 15 kilometers from Eldorado’s Perama Hill project in Greece. Glory reported that the Sapes project is compliant with the Joint Ore Reserves Committee (JORC) and has total proven and probable reserves of 637,000 ounces of gold at an average grade of 15.1 grams per tonne. Similarly, B2Gold has agreed to acquire the outstanding shares of Volta Resources through a friendly acquisition. Volta has an 81 percent interest in the Kiaka gold project in Burkino Faso with a potential to produce 340,000 ounces of gold. These two transactions continue to highlight our opinion that the cheapest resources already are listed, paving the way for more prolific mergers and acquisitions in the near future.
- Comstock Mining announced that Nevada regulators have approved a major modification to the company’s Water Pollution Control Permit. This modified permit increases the amount of mineralized material the company may process annually from the previous 1 million tonnes of material per annum to 4 million tonnes per annum. The permit also authorizes the expansion of the company’s existing heap leach pad facilities. According to the company’s CEO, the approval allows for an expedited heap leach expansion from five to eight cells, increasing rates of production and significantly dropping unit costs associated with producing the planned 40,000 gold-equivalent ounces for next year.
- Sell-side analysts and traders’ commentaries have highlighted a noticeable pickup in generalist and fundamental accounts buying large cap gold names in recent days. According to Macquarie, the move appears to be motivated by the fact that a lot of the bad news is already out there, and it’s likely for companies to surprise to the upside rather than perform negatively. As a matter of fact, Barrick Gold reported earnings this week showing a noticeable improvement on the bottom line, with earnings per share of $0.58 versus the analysts’ consensus of $0.51. Both gold and copper operations beat their operational targets, but the most significant improvement came on the cost side, where Barrick reported an 85 percent completion of its corporate downsizing program.
Weaknesses
- The spot gold price on the Shanghai Gold Exchange dropped below the London price this week, signaling that demand may be waning in the world’s second-largest gold market. Bloomberg reports that gold was selling at a 54.14 percent discount to the London price on Wednesday on very low volume in the Shanghai Gold Exchange.
- A recent International Monetary Fund (IMF) report shows that the gold holdings in Russia’s Central Bank fell for the first time since August 2012, decreasing 0.4 tonnes in September. However, Russia has added more than 50 tonnes to its gold reserves this year alone and about 600 tonnes since 2007. It is expected that gold purchases by central banks will decrease to 350 tonnes this year from 544 tonnes in 2012. Despite the decrease, analysts agree that central banks will remain substantial net buyers of gold in years to come.
- During the release of its third-quarter financial results, Yamana Gold issued a warning to investors this week saying it may not reach its stated 2013 production target of 1.7 million gold-equivalent ounces. During the third quarter of 2013, Yamana reported production of 306,935 gold-equivalent ounces, trailing its third quarter 2012 production of 310,490 gold-equivalent ounces. The greatest disappointment came when CEO Peter Marrone commented that the company is not presently in a position to reiterate or amend its full year 2013 production guidance, leading investors to believe the company will miss its production estimate.
Opportunities
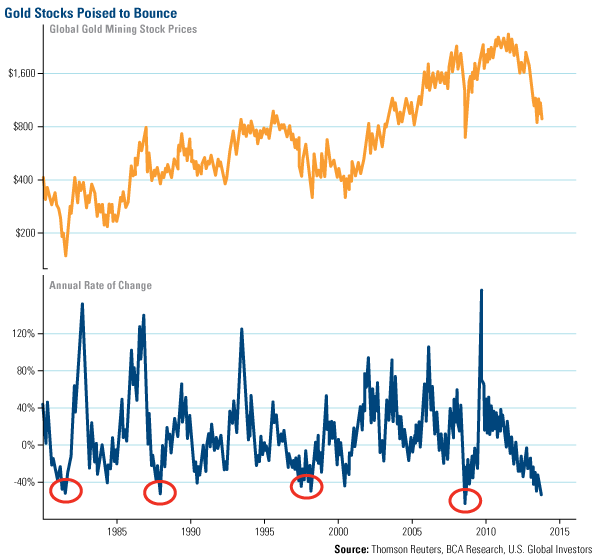
- Jeffrey Currie, an analyst with Goldman Sachs, suggested just under a month ago that gold miners should hedge their output and lock current prices. In his opinion, gold would be the next big short trade. Other analysts, including Tom Kendall of Credit Suisse, also followed with negative commentary on the gold market, adding their names to the short-selling list. It’s interesting that this group dares to recommend that investors do the exact opposite of what asset allocation studies show: adding gold and gold stocks to a portfolio can add alpha without a significant increase to risk. Not only are these analysts ignoring proven academic research, they seem to be ignoring reality. BCA Research published a report at the end of last week highlighting that gold prices have failed to rise in recent months in spite of a weak dollar, adding that a catch-up is likely. BCA argues that gold is oversold on a technical basis, as seen in the chart above, which in itself could be enough to drive a gold rally above the $1,500 per ounce threshold.
- This week, RBC Capital Markets published the fifth part of its study on capital and operating cost expectations in the gold market. In the report, RBC underlines that capital costs have stabilized while all-in sustaining costs could fall by $150 per ounce in 2014 alone. RBC argues that since prices have fallen by a larger extent than all-in costs, this should discredit gold producers’ efforts to maintain or increase their returns on capital. After rising by 60 percent over the past three years, it appears 2014 may actually be a good time to build projects given the availability of engineering and equipment. Those companies that learned the importance of protecting balance sheet integrity and returns on capital will be the biggest beneficiaries of this new stage in capital costs, at the expense of those who were growing for the sake of growing.
- Mineweb contributor Dorothy Kosich reports that in a rare show of bipartisanship, Congressional Democrats and Republicans introduced a comprehensive bill aimed at fostering and facilitating the domestic growth of critical minerals to prevent future supply shocks. This highlights the urgent need to facilitate the development of American mineral deposits. The ultimate purpose of the bill is to ensure that officials are required to set, and adhere to, timelines and schedules for completion of reviews as well as for inspection and enforcement activities in the mining sector. According to Hal Quinn, CEO of the National Mining Association, the slow and inefficient permitting system in the U.S. is the largest impediment to unlocking the full value of American minerals, adding that the U.S. relies on foreign countries such as China to supply many of these critical minerals.
Threats
- David Zervos of Jefferies wrote quite an entertaining and ironic takedown on Janet Yellen’s nomination to the Federal Reserve Chairmanship. According to Zervos, the most exciting part about having Yellen in the seat is her inherent mistrust of market prices and her belief in irrational behavior processes. Zervos adds that there likely will be a day in 2016 when unemployment is still well above Yellen’s estimate and the headline inflation rate is above 4 percent, in which the Fed’s models will still show a big output gap and lots of slack. This way, Yellen could continue talking down inflation risks. In fact, Zervos argues that Yellen’s obsession with filling the output gap makes for a very real chance of policy mistakes down the road, similar to those resulting from an obsession with Keynesian mis-measuring of the output gap during the 1970s.
- Alan Greenspan published his new book “The Map and the Territory” in which he warns, among other things, that the “Spectacle of American central bankers trying to press the inflation rate higher in the aftermath of the 2008 crisis is virtually without precedent.” He follows up by commenting that this type of policy could easily trigger double-digit inflation. In light of this, David Rosenberg of Gluskin Sheff proposed a new mantra for the Federal Reserve: “Bring on inflation!” However, Rosenberg followed up by criticizing the Fed’s optimistic sentiment that inflation is good for economic growth, in which there is no widely accepted evidence or studies to support the assertion. For those who still believe in the Fed’s optimism after Wednesday’s meeting, consider Rosenberg’s list of market facts that show financial asset overheating: 1) valuations are no longer cheap, no matter the measure; 2) 80 percent of S&P stocks are trading above their 50 day moving average; 3) mutual fund and ETF inflows are at dot-com bubble levels; 4) NYSE margin debt just hit an all-time high; 5) portfolio managers are sitting on thin, 3.5 percent cash ratios; and 6) the VIX is sitting at 13 points, showcasing how few feel the need to buy downside protection. The list is simply too long to continue, but the point comes across easily.
- This week, the Mexican Senate approved the Fiscal Reform package passed last week by the Chamber of Deputies. Among other things, the package consists of a special mining fee of 7.5 percent on EBITDA and a 0.5 percent royalty on gross earnings. According to BMO Capital Markets, the new fiscal levies will result in significant negative impacts, ranging from 0 to 15 percent, to the net asset value (NAV) of companies with Mexican exposure. Among the most affected are companies such as Timmins Gold, MAG Silver and Pan American Silver, which have a 100 percent valuation exposure to Mexico.
October 31, 2013What the End of a Greek Tragedy Means for Investors |
October 28, 2013Why Growth is Deep in the Heart of Texas |
October 21, 2013Trying to Stop a Bull Market Has Risks |
Energy and Natural Resources Market
Strengths
- Steel and iron ore mining stocks gained for the fourth consecutive month. Iron ore prices remain over $130 per tonne and Chinese economic data continues to point to expansion. China’s official PMI climbed to an eighteen-month high of 51.4 in October versus 51.1 in September.
- The weekly average price for copper gained slightly as the price of the metal continues to hover around $3.30 per pound. Bellwether copper miner Freeport-McMoRan closed at a 52-week high this week, gaining nearly 40 percent since the end of June.
Weaknesses
- West Texas Intermediate lost 3.5 percent this week, slipping back to levels not seen since late June, and remaining on a four-week losing streak.
- Precious metals sold off late in the week as the U.S. dollar bounced off the 79 level. Gold fell 2.5 percent and silver fell 2.7 percent, while platinum and palladium were flat on the week.
Opportunities
- China’s steel output will exceed 800 million metric tonnes next year as fixed asset investment and economic growth remains steady, according to Li Xinchuang, Vice Secretary General at the China Iron and Steel Association. Crude steel production will rise from an estimated 780 million tonnes this year, according to Xinchuang who is also head of the Metallurgical Industry Planning & Research Institute, during an interview today. "Steel output is likely to rise as long as China’s fixed asset investment can meet 17 percent growth and the gross domestic product can expand 7.4 percent next year," he said. The world’s second-largest economy will probably grow 7.6 percent this year and 7.4 next year, as the nation tackles local government debt and financial reforms, according to the median of 52 economists’ forecasts survey by Bloomberg this month.
- In Russia, the government approved a long-awaited law to liberalize liquefied natural gas (LNG) exports for independent companies. Speaking to a government meeting in Moscow, Russian Prime Minister Dimitry Medvedev said, "Let’s hope that this will create additional scope for the whole energy industry and allow us to secure a footing in fast growing economies," Reuters reported. At present, only Gazprom and its wholly-owned subsidiaries are permitted to export LNG out of Russia.
- Mergers and acquisitions (M&A) activity is increasingly trending toward exploration and production assets and new discoveries while corporate deals are on the decline. About 45 percent of all M&A transactions so far this year were for producing assets, while 24 percent were for development projects, and 10 percent were for interests in new discoveries, according to a study by London and Bangalore’s Derrick Petroleum Services and Houston’s PLS. Over the same period, corporate deals are trending downward to the lowest level on record at 21 percent, compared to a five-year average of 55 percent, says the research and advisory firms. The analysts said a record $135 billion worth of assets were currently in play for M&A.
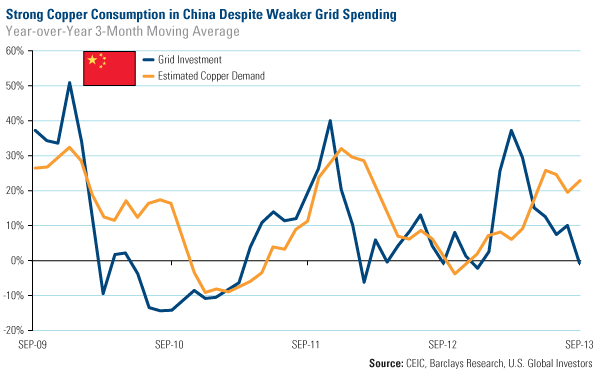
- China’s consumption of refined copper is expected to grow quicker in 2014. However, the consumption is not fast enough to boost imports significantly as production increases quickly, according to state-backed research firm Antaike. China is the world’s top producer and consumer of the metal and imports have been dropping in line with weaker economic activity, dragging international prices down nearly 10 percent so far this year. Nevertheless, the market has been looking for a rebound next year as the economy stabilizes and infrastructure spending increases. China’s consumption of refined copper is forecast to grow 6.5 percent to 8.7 million tonnes in 2014, as Beijing continues to invest heavily in the power sector, according to Antaike’s chief copper analyst Yang Changhua.
Threats
- OGX Petróleo e Gas Participações S.A., the Brazilian oil company controlled by former billionaire Eike Batista, sought court protection from creditors this week in Latin America’s largest-ever corporate bankruptcy filing. The bankruptcy protection request, filed in a Rio de Janeiro court, came after OGX failed to reach an agreement with creditors to renegotiate part of its $5.1 billion debt load. The request marks another chapter in the unraveling of Batista’s once high-flying industrial empire, which he has been dismantling in recent months after disappointing output from offshore OGX wells set off a crisis of investor confidence.
- Zambia will restore a 10 percent export tax for unprocessed metals less than a month after the government removed the levy, Bloomberg reports. President Michael Sata ordered the government to repeal the law that removed the tax in comments broadcast on state-owned ZNBC. Treasury Secretary Fredson Yamba confirmed the decision by phone, the report stated. The law abolished the tax for about a year. The reinstatement will be effective “when the finance minister signs it,” Yamba said.
China Region Fund – USCOX • Emerging Europe Fund – EUROX
Emerging Markets
Strengths
- China’s October official manufacturing PMI exceeded market expectation at 51.4 up from 51.1 in September, and beats market consensus of 51, indicating China is sustaining its economic growth coming into the fourth quarter of the year. The HSBC final PMI is unchanged from flash number at 50.9 up from 50.2 in September, also confirming China’s economy is in expansionary territory.
- Macau October gross revenue was MOP36.5 billion, reaching a new record after growing 32 percent year-over-year, exceeding market expectations. Macau’s momentum continues as the largest enclave of gaming entertainment in the world, supported by the vast population in China.
- Among Chinese companies that have reported third-quarter earnings, including dual-listed H-shares companies in Hong Kong, they have shown earnings growth of 21.2 percent year-over-year, showing noticeable improvements from the 13.4 percent growth in second quarter this year and -2.5 percent in the third quarter in 2012. Core earnings of non-financials went up by 24.8 percent versus -6.9 percent in second quarter and -26.9 percent in the same period of last year, according to Bank of America Merrill Lynch equity research analysts.
- The H-share listed Chinese banks reported third-quarter net profit after tax growth of 11.2 percent year-over-year, net interest margin improvement of 1 basis point over the prior quarter to 2.57 percent, loan growth of 13 percent year-over-year, and low non-performing loan ratio of 0.98 percent. Net fee income fell by 10.4 percent on a quarter-over-quarter basis, but grew 18.4 percent year-over-year. The sector showed tight cost control and de-leveraging which lead to strong asset quality and improving capital ratio.
- Hong Kong’s September loan growth was 2.2 percent month-over-month, 18.1 percent year-over-year, and 14.9 percent year-to-date, while deposits were 2.9 percent month-over-month, 12.2 percent year-over-year, and 7.3 percent for the year-to-date period at the end of September, showing the strength of money supply.
- Indonesia’s October CPI declined to 8.32 percent down from 8.40 percent in September and 8.79 percent in August. The impact of the fuel price hike on inflation is over as the government had expected.
- Korean October exports grew by 7.1 percent year-over-year and 3.9 percent month-over-month. The faster-than-expected growth is driven by recovery in the U.S. and eurozone, continued upswing in information technology and auto, and increased exports to emerging markets.
- Moody’s ratified Chile’s Aa3 sovereign debt rating this week while maintaining the outlook at stable. The credit rating agency stressed that the country’s social and political consensus implies a continuation of the solid institutional framework going forward. Fitch Ratings also ratified its A+ Chilean sovereign debt rating last week.
- An annual World Bank study on business environment has reported Russia made the most progress among the biggest emerging economies in implementing policies to improve its business environment. The jump from 112th position last year report to 92nd place this year was the biggest gain among the BRIC nations. President Vladimir Putin, who is facing lackluster economic growth and high inflation, ordered the government to improve Russia’s standing in the ranking to 20th by 2018 as part of a plan announced after his inauguration to a third term last year.
Weaknesses
- Indonesian trade balance in September worsened to a deficit of $657 million (+$72 million in August and -$2.3 billion in July), mainly due to still weak exports, which reached $14.8 billion, but remained weak, down 7 percent year-over-year. Imports were relatively stagnant, up 1 percent year-over-year in September.
- The amnesty bill’s third reading in Thailand’s parliament could flare a political risk in addition to weak private consumption (down 6.1 percent in September) and deteriorating manufacturing production index (down 2.9 percent in September and down 2.8 percent in August), and a current account deficit of $6.05 billion year-to-date at the end of September.
- Deflationary pressure continued in Korea when October CPI fell further to 0.7 percent, the lowest since 1999, due to favorable weather conditions and a strengthening won.
- Despite recent signs of recovery in the Mexican economy, HSBC has lowered its GDP estimates for this year to 1.3 percent from 1.7 percent. The two main reasons behind the revision are: 1) natural disasters that occurred in September have negatively impacted some productive activities; and 2) the partial government shutdown in the U.S., which may prompt lower U.S. GDP growth for the remainder of the year.
- Czech general election results from last weekend are extending political uncertainty in the central European nation, according to Moody’s. The inconclusive election result, in which the Social Democrats claimed victory by a very narrow margin, is likely to result in difficult and lengthy negotiations to form a government, and will “likely prolong the political uncertainty that has deterred economic sentiment over the last few months,” according to the U.S. based credit rating agency.
Opportunities
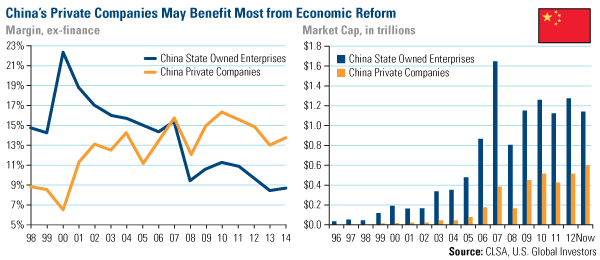
- As shown in the charts above, in China, private companies are playing increasingly important roles in the economy by creating most of the jobs in the country. Due to their efficiency and better incentives for outperformance, the private sectors have seen their gross profit margins surpass those for state-owned enterprises (SOE) and their market cap are increasing versus decreasing for SOEs. Many of the upcoming reforms in China are concerning opening up SOE monopolized sectors to private companies, which will be adding another driver to revenue and profit growth for privately-own companies.
- The Peruvian government announced investments in infrastructure for a total of $8 billion, to be deployed by early 2014, in projects including the Metro line 2 of Lima, and the building or expansion of airports. Similarly, Colombian President Juan Manuel Santos opened the auction process for the first tranche of the 4th generation road concession program, which is estimated to require a $5.9 billion investment.
- Greek stocks are outperforming almost every market in the world as a six-year recession eases and new investors consider purchases. Since bottoming out on June 5, 2012, the country’s ASE Index has surged 159 percent, still 77.5 percent below its 2007 peak. As a result of the lengthy crisis, Greek companies cut their cost bases, cutting wages and pensions, and set the ground for profitability growth to surprise once the economy starts growing. Equity fund flows into Greece rose 129 percent from the beginning of the year through October 28, handsomely outpacing the 15 percent rise for Europe as a whole, data from EPFR Global Inc. show. The next likely catalyst will come as emerging market funds with a mandate to follow MSCI indexes will start to invest in Greek stocks after Greece is included officially in the MSCI Emerging Markets Index on November 26.
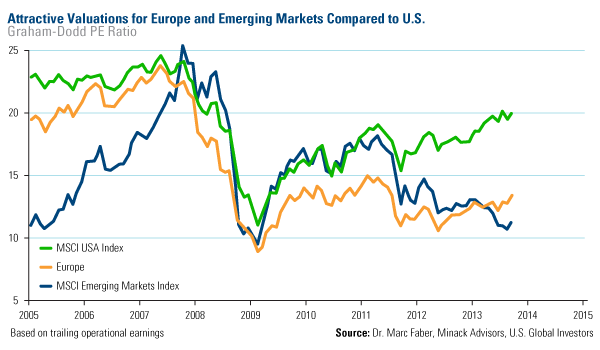
- Not only is valuation of European equities low relative to S&P 500, but they are also forming a major low against emerging market equities, technically speaking. The further outflows from emerging markets are likely to go to Europe as opposed to the U.S.
Threats
- Between October 19 and 30, China’s interbank rates surged by about 220 basis points but finally slid on October 31 by 60 basis points. Having been concerned about a possible repeat of the June liquidity squeeze and monetary tightening in the past 10 days, investors finally breathed a sigh of relief. Analysts and economists believe markets are overly sensitive to the volatility in China’s interbank markets, while the People’s Bank of China (PBOC) could improve its skills in open market operations (OMO) and communication. BofA Merrill Lynch expected the interbank rates to fall back to a normal level (between 3-4 percent for overnight Shibor).
- Brazil’s state-run oil company Petrobras said in a market filing it has proposed a methodology to its government-controlled board that would automatically adjust domestic diesel and gasoline prices to international prices. According to Reuters, the company has lost more than $14 billion since the start of 2012 in its refining division due to a government policy that holds down fuel prices to contain inflation. The company imports fuel at international prices then sells it at a 10 to 15 percent loss at home. The price adjustment is unlikely to be approved given that government controls on fuel prices have been vital as Brazil’s central bank has been battles high inflation.
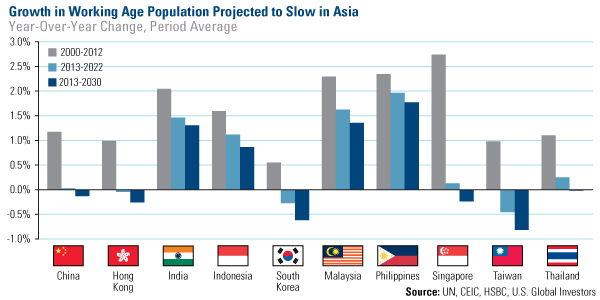
- A recent HSBC Economic Research report shows growth in working age populations is set to slow sharply over the coming 10 years in all Asian markets, with China, Hong Kong, Korea, Singapore, Taiwan and Thailand among the most affected. Even in the better faring Asian nations, working age populations will not expand as rapidly as in the recent past. HSBC concludes that, assuming no change to productivity growth, and a steady rate of investment, this demographic shift inevitably represents a drag on GDP growth, by means of fewer additional workers and less incremental output. Just in China, one of the better faring economies, a slowdown in the growth of the working age population could shave about 0.5 percent off annual GDP growth, according to HSBC.
Leaders and Laggards
The tables show the weekly, monthly and quarterly performance statistics of major equity and commodity market benchmarks of our family of funds.
| Index | Close | Weekly Change($) |
Weekly Change(%) |
|---|---|---|---|
| 10-Yr Treasury Bond | 2.62 | +0.11 | +4.50% |
| Hang Seng Composite Index | 3,228.62 | +71.83 | +2.28% |
| DJIA | 15,615.55 | +45.27 | +0.29% |
| Korean KOSPI Index | 2,039.42 | +5.03 | +0.25% |
| S&P 500 | 1,761.64 | +1.87 | +0.11% |
| S&P Energy | 627.55 | -2.27 | -0.36% |
| Nasdaq | 3,922.04 | -21.32 | -0.54% |
| S&P Basic Materials | 275.25 | -3.53 | -1.27% |
| Russell 2000 | 1,095.67 | -22.67 | -2.03% |
| Gold Futures | 1,315.50 | -37.00 | -2.74% |
| Oil Futures | 94.61 | -3.24 | -3.31% |
| Natural Gas Futures | 3.51 | -0.19 | -5.23% |
| XAU | 92.04 | -7.68 | -7.70% |
| S&P/TSX Canadian Gold Index | 171.82 | -16.16 | -8.60% |
| Index | Close | Monthly Change($) |
Monthly Change(%) |
|---|---|---|---|
| S&P 500 | 1,761.64 | +66.64 | +3.93% |
| S&P Basic Materials | 275.25 | +9.02 | +3.39% |
| S&P Energy | 627.55 | +19.41 | +3.19% |
| DJIA | 15,615.55 | +423.85 | +2.79% |
| Nasdaq | 3,922.04 | +104.06 | +2.73% |
| Gold Futures | 1,315.50 | +29.40 | +2.29% |
| Korean KOSPI Index | 2,039.42 | +40.55 | +2.03% |
| Russell 2000 | 1,095.67 | +8.24 | +0.76% |
| XAU | 92.04 | +0.68 | +0.74% |
| S&P/TSX Canadian Gold Index | 171.82 | +0.35 | +0.20% |
| 10-Yr Treasury Bond | 2.62 | -0.03 | -1.06% |
| Natural Gas Futures | 3.51 | -0.10 | -2.66% |
| Oil Futures | 94.61 | -7.43 | -7.28% |
| Hang Seng Composite Index | 3,228.62 | -332.01 | -14.83% |
| Index | Close | Quarterly Change($) |
Quarterly Change(%) |
|---|---|---|---|
| Hang Seng Composite Index | 3,228.62 | +196.96 | +6.50% |
| S&P Basic Materials | 275.25 | +16.76 | +6.48% |
| Nasdaq | 3,922.04 | +232.45 | +6.30% |
| Korean KOSPI Index | 2,039.42 | +116.04 | +6.03% |
| Natural Gas Futures | 3.51 | +0.17 | +4.96% |
| Russell 2000 | 1,095.67 | +35.81 | +3.38% |
| S&P 500 | 1,761.64 | +51.97 | +3.04% |
| S&P Energy | 627.55 | +16.59 | +2.72% |
| 10-Yr Treasury Bond | 2.62 | +0.03 | +1.00% |
| Gold Futures | 1,315.50 | +5.00 | +0.38% |
| DJIA | 15,615.55 | -42.81 | -0.27% |
| XAU | 92.04 | -2.15 | -2.28% |
| S&P/TSX Canadian Gold Index | 171.82 | -4.26 | -2.42% |
| Oil Futures | 94.61 | -12.33 | -11.53% |
Please consider carefully a fund’s investment objectives, risks, charges and expenses. For this and other important information, obtain a fund prospectus by visiting www.usfunds.com or by calling 1-800-US-FUNDS (1-800-873-8637). Read it carefully before investing. Distributed by U.S. Global Brokerage, Inc.
An investment in a money market fund is neither insured nor guaranteed by the Federal Deposit Insurance Corporation or any other government agency. Although the fund seeks to preserve the value of your investment at $1.00 per share, it is possible to lose money by investing in the fund.
All opinions expressed and data provided are subject to change without notice. Some of these opinions may not be appropriate to every investor.
Foreign and emerging market investing involves special risks such as currency fluctuation and less public disclosure, as well as economic and political risk. By investing in a specific geographic region, a regional fund’s returns and share price may be more volatile than those of a less concentrated portfolio.
The Emerging Europe Fund invests more than 25 percent of its investments in companies principally engaged in the oil & gas or banking industries. The risk of concentrating investments in this group of industries will make the fund more susceptible to risk in these industries than funds which do not concentrate their investments in an industry and may make the fund’s performance more volatile.
Because the Global Resources Fund concentrates its investments in a specific industry, the fund may be subject to greater risks and fluctuations than a portfolio representing a broader range of industries.
Gold, precious metals, and precious minerals funds may be susceptible to adverse economic, political or regulatory developments due to concentrating in a single theme. The prices of gold, precious metals, and precious minerals are subject to substantial price fluctuations over short periods of time and may be affected by unpredicted international monetary and political policies. We suggest investing no more than 5 percent to 10 percent of your portfolio in these sectors. Investing in real estate securities involves risks including the potential loss of principal resulting from changes in property value, interest rates, taxes and changes in regulatory requirements.
Tax-exempt income is federal income tax free. A portion of this income may be subject to state and local income taxes, and if applicable, may subject certain investors to the Alternative Minimum Tax as well. Each tax free fund may invest up to 20 percent of its assets in securities that pay taxable interest. Income or fund distributions attributable to capital gains are usually subject to both state and federal income taxes. Bond funds are subject to interest-rate risk; their value declines as interest rates rise. The tax free funds may be exposed to risks related to a concentration of investments in a particular state or geographic area. These investments present risks resulting from changes in economic conditions of the region or issuer.
Past performance does not guarantee future results.
BRIC refers to the emerging market countries Brazil, Russia, India and China.
These market comments were compiled using Bloomberg and Reuters financial news.
Holdings as a percentage of net assets as of 9/30/13:
Pioneer Natural Resources Co.: Global Resources Fund, 2.36%
Enterprise Products Partners: Global Resources Fund, 2.18%
Valero: 0.0%
AT&T, Inc.: All American Equity Fund, 1.18%
Vodafone Group plc: 0.0%
J.C. Penney Co., Inc.: 0.0%
MeadWestvaco Corp.: 0.0%
Plum Creek Timber Co., Inc.: 0.0%
Avon Products, Inc.: 0.0%
Eldorado Gold Corp.: Gold and Precious Metals Fund, 0.22%; World Precious Minerals Fund, 0.12%
Glory Resources: 0.0%
B2Gold Corp.: Gold and Precious Metals Fund, 2.93%; World Precious Minerals Fund, 2.20%
Volta Resources, Inc.: 0.0%
Comstock Mining, Inc.: Gold and Precious Metals Fund, 3.47%; World Precious Minerals Fund, 2.00%
Barrick Gold Corp.: Gold and Precious Metals Fund, 4.25%; World Precious Minerals Fund, 0.47%
Yamana Gold, Inc.: Gold and Precious Metals Fund, 2.76%; World Precious Minerals Fund, 1.25%
Timmins Gold Corp.: Gold and Precious Metals Fund, 0.96%; World Precious Minerals Fund, 0.23%
MAG Silver Corp.: World Precious Minerals Fund, 2.77%
Pan American Silver Corp.: Gold and Precious Metals Fund, 1.23%; World Precious Minerals Fund, 0.05%
Freeport-McMoRan Copper & Gold, Inc.: Global Resources Fund, 3.27%; Gold and Precious Metals Fund, 0.14%; World Precious Minerals Fund, 0.13%
Gazprom OAO: Emerging Europe Fund, 4.05%
OGX Petróleo e Gas Participações S.A.: 0.0%
Petrobras: 0.0%
*The above-mentioned indices are not total returns. These returns reflect simple appreciation only and do not reflect dividend reinvestment.
The Dow Jones Industrial Average is a price-weighted average of 30 blue chip stocks that are generally leaders in their industry.
The S&P 500 Stock Index is a widely recognized capitalization-weighted index of 500 common stock prices in U.S. companies.
The Nasdaq Composite Index is a capitalization-weighted index of all Nasdaq National Market and SmallCap stocks.
The S&P BARRA Growth Index is a capitalization-weighted index of all stocks in the S&P 500 that have high price-to-book ratios.
The S&P BARRA Value Index is a capitalization-weighted index of all stocks in the S&P 500 that have low price-to-book ratios.
The Russell 2000 Index® is a U.S. equity index measuring the performance of the 2,000 smallest companies in the Russell 3000®, a widely recognized small-cap index.
The Hang Seng Composite Index is a market capitalization-weighted index that comprises the top 200 companies listed on Stock Exchange of Hong Kong, based on average market cap for the 12 months.
The Taiwan Stock Exchange Index is a capitalization-weighted index of all listed common shares traded on the Taiwan Stock Exchange.
The Korea Stock Price Index is a capitalization-weighted index of all common shares and preferred shares on the Korean Stock Exchanges.
The Philadelphia Stock Exchange Gold and Silver Index (XAU) is a capitalization-weighted index that includes the leading companies involved in the mining of gold and silver.
The U.S. Trade Weighted Dollar Index provides a general indication of the international value of the U.S. dollar.
The MSCI Russia Index is a free-float weighted equity index developed in 1994 to track major equities traded in the Russian market.
The S&P/TSX Canadian Gold Capped Sector Index is a modified capitalization-weighted index, whose equity weights are capped 25 percent and index constituents are derived from a subset stock pool of S&P/TSX Composite Index stocks.
The S&P 500 Energy Index is a capitalization-weighted index that tracks the companies in the energy sector as a subset of the S&P 500.
The S&P 500 Materials Index is a capitalization-weighted index that tracks the companies in the material sector as a subset of the S&P 500.
The S&P 500 Financials Index is a capitalization-weighted index. The index was developed with a base level of 10 for the 1941-43 base period.
The S&P 500 Industrials Index is a Materials Index is a capitalization-weighted index that tracks the companies in the industrial sector as a subset of the S&P 500.
The S&P 500 Consumer Discretionary Index is a capitalization-weighted index that tracks the companies in the consumer discretionary sector as a subset of the S&P 500.
The S&P 500 Information Technology Index is a capitalization-weighted index that tracks the companies in the information technology sector as a subset of the S&P 500.
The S&P 500 Consumer Staples Index is a Materials Index is a capitalization-weighted index that tracks the companies in the consumer staples sector as a subset of the S&P 500.
The S&P 500 Utilities Index is a capitalization-weighted index that tracks the companies in the utilities sector as a subset of the S&P 500.
The S&P 500 Healthcare Index is a capitalization-weighted index that tracks the companies in the healthcare sector as a subset of the S&P 500.
The S&P 500 Telecom Index is a Materials Index is a capitalization-weighted index that tracks the companies in the telecom sector as a subset of the S&P 500.
The Bloomberg Gold Bear/Bull Sentiment Indicator charts the percent of respondents in a weekly Bloomberg News survey of traders, investors, and analysts predicting gold prices will rise the following week. The number of participants in the survey, which is completed every Friday, may vary.
The NYSE Arca Gold Miners Index is a modified market capitalization weighted index comprised of publicly traded companies involved primarily in the mining for gold and silver.
The S&P/TSX Global Gold Index is an international benchmark tracking the world’s leading gold companies with the intent to provide an investable representative index of publicly-traded international gold companies.
The NYSE Arca Gold BUGS (Basket of Unhedged Gold Stocks) Index (HUI) is a modified equal dollar weighted index of companies involved in gold mining. The HUI Index was designed to provide significant exposure to near term movements in gold prices by including companies that do not hedge their gold production beyond 1.5 years.
The ISM manufacturing composite index is a diffusion index calculated from five of the eight sub-components of a monthly survey of purchasing managers at roughly 300 manufacturing firms from 21 industries in all 50 states.
The Purchasing Manager’s Index is an indicator of the economic health of the manufacturing sector. The PMI index is based on five major indicators: new orders, inventory levels, production, supplier deliveries and the employment environment.
The S&P Volatility Index (VIX) shows the market’s 30-day volatility, and is a widely used measure of market risk.
The Consumer Price Index (CPI) is one of the most widely recognized price measures for tracking the price of a market basket of goods and services purchased by individuals. The weights of components are based on consumer spending patterns.
The MSCI Emerging Markets Index is a free float-adjusted market capitalization index that is designed to measure equity market performance in the global emerging markets.


