


Investor Alert
China’s Economic Recovery: 3 Key Sectors to Watch
Date Posted: April 21, 2023
Read time: 39 min
Chinese economic data blew expectations out of the water this week, reflecting a strong comeback for the Asian giant as it finally emerges from the world’s most restrictive pandemic-era lockdown. The positive results are constructive for industries and sectors across the board, but I’ll be closely watching the global luxury goods market, air passenger demand and container shipping in particular.
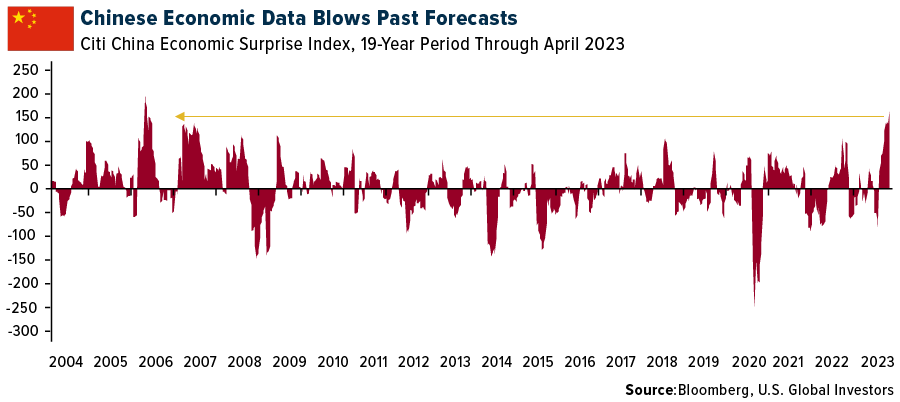
In the first quarter, China’s gross domestic product (GDP) grew a healthy 4.5% year-over-year, exceeding consensus. Retail sales in March jumped 10.6% year-over-year, a pace unseen in two years. As a result, the Citi China Economic Surprise Index, which measures data surprises relative to market expectations, hit a 17-year high. UBS Group raised its 2023 GDP forecast to “at least” 5.7%, with the bank’s Patricia Lui writing that “consumption will remain the main driver of China’s recovery this year.”
European Luxury Retailers Bracing for the Return of China’s Luxury Shoppers
Again, this is all very constructive for European luxury stocks. Before the pandemic, Chinese consumers were the leading nationality for tax-free luxury shopping worldwide, according to Swiss-based tourism shopping firm Global Blue. A whopping one-third of global luxury sales, or 93 billion euros ($102 billion), were made by Chinese shoppers in 2019, a vast majority of them while traveling abroad.
It may take two years for a return to that level, but many retailers are already seeing an uptick. The massive luxury conglomerate LVMH and Hermes International both reported a surge in first-quarter sales thanks to the return of Chinese shoppers. The best-performing group in Europe’s STOXX 600 Index so far this year is consumer products and services, up more than 26%. This is followed by leisure and travel, up 24%; and retail, up 22%.
The best-performing luxury stocks, meanwhile, include Hermes, up 38.6% year-to-date; Moncler, up 35%; and LVMH, up 32%.
As we reported in last week’s Investor Alert, these gains helped Paris, France-listed stocks, as measured by the CAC 40 Index, hit a new record high, a feat that the index repeated today. Besides Hermes and LVMH, the index’s best-performing stocks in 2023 also include L’Oreal, up 36%.
In Europe, “luxury is seen as the highest quality sector by investors, in the same way technology is seen as the best growth sector in the U.S.,” comments Zuzanna Pusz, an analyst at UBS.
Chinese Airlines Gradually Increasing Capacity, Projected to Hit 75% of 2019 Levels by Year-End
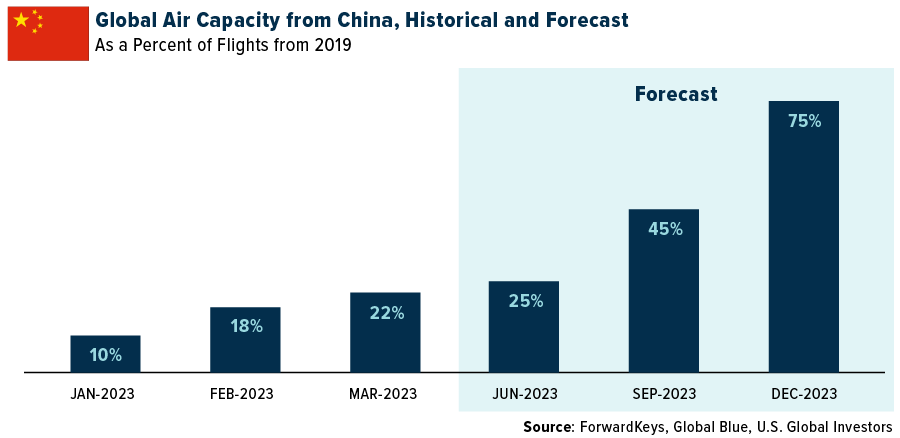
After three years of strict lockdown, many middle- and high-income Chinese shoppers are eager to travel internationally again. The problem is that air capacity is currently only at 22% of 2019 levels. ForwardKeys and Global Blue project capacity to reach 45% of pre-pandemic levels after the summer and 75% by the end of this year. An estimated 110 million outbound trips from mainland China will take place this year, or two-thirds of 2019 traffic, according to the China Outbound Tourism Research Institute (COTRI). Singapore is expected to be the top destination.
In the coming weeks and months, this air travel recovery should be reflected in Chinese airline share prices, which currently lag most other regions so far this year. European carriers are currently the top performers, with budget airline easyJet up a phenomenal 57% year-to-date. Other carriers that are up double digits include Air France (+24.6%), Germany’s Lufthansa (+24%), Ireland’s Ryanair (+21%) and International Airlines Group (IAG) (+20.7%).
Shanghai Shipping Rates Have Risen for Four Straight Weeks
The last industry I’m pointing out here is container shipping. The investment case isn’t as strong as luxury and airlines, but there are signs that conditions have steadied following months of deterioration, making the industry one to keep an eye on.
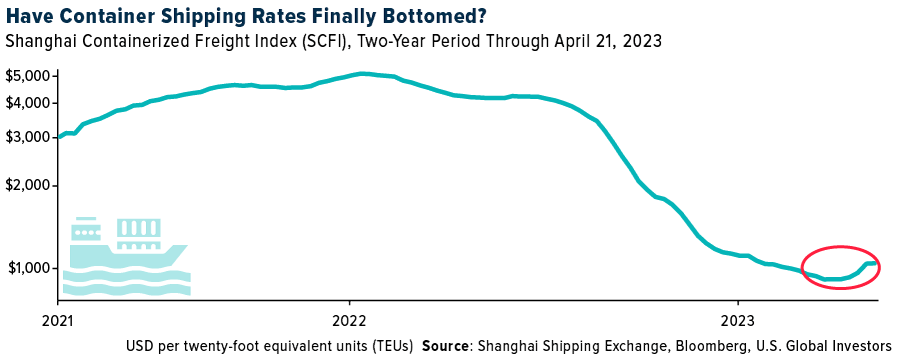
Shipping rates skyrocketed during the pandemic as socially distancing consumers, flush with stimulus money, spent their earnings on goods instead of services. This resulted in days-long delays at ports across the globe. But since the peak in September 2021—when the cost to ship a forty-feet equivalent unit (FEU) has hit an incredible $11,000, according to the Freightos Baltic Index—global rates have been in freefall.
In China, these rates appear to have found a bottom. In the logarithmic chart below, you can see that the Shanghai Containerized Freight Index (SCFI) has turned up for four straight weeks, the longest upward trajectory since December 2021. Outside of another global event, rates aren’t returning to pandemic-era levels anytime soon, but the move is constructive. Shanghai is the world’s largest port, so I consider its data to be a leading indicator
Morgan Stanley also sees a freight upcycle nearing. In a quarterly survey, shipping companies said they expected global freight demand to improve this year. Nearly three out of four carriers believed inventories would normalize in 2023, with almost half saying it would happen in the second half.
For more on luxury, airlines and shipping, subscribe to my free, award-winning blog Frank Talk by clicking here!
Index Summary
- The major market indices finished down this week. The Dow Jones Industrial Average lost 0.23%. The S&P 500 Stock Index fell 0.10%, while the Nasdaq Composite fell 0.42%. The Russell 2000 small capitalization index gained 0.58% this week.
- The Hang Seng Composite lost 2.18% this week; while Taiwan was down 2.05% and the KOSPI fell 1.05%.
- The 10-year Treasury bond yield rose 0.05 basis points to 3.57%.

Airlines and Shipping
Strengths
- The best performing airline stock for the week was United, up 6.5%. EasyJet’s guidance for F3Q23 revenue per seat (RPS) of 20% year-over-year was above consensus. Revenue of £2.7 billion for the first half of fiscal 2023 was 2%-3% ahead of consensus estimates due to better-than-expected ticket fares. Revenue per seat was up 43%, but airline unit costs ex-fuel also rose 8% year-over-year.
- Tanker fundamentals remain favorable with record low orderbook-to-fleet ratios (3.9%), as shipyards remain fully booked. Tanker fleet growth is expected to average below 1% this year and next, according to Clarkson’s, while average speeds should continue to trend lower as carriers engage in slow steaming for older vessels to minimize environmental impact.
- United Airlines reported a March quarter adjusted loss per share of $0.63, ahead of FactSet consensus of -$0.73. The beat was primarily driven by better operating and non-operating costs as revenue was in line with the company’s latest guidance. Looking forward, United reiterated 2023 earnings per share (EPS) guidance of $10 to $12 (versus consensus of $8.56). The June quarter revenue outlook of +14% to +16% is in line with consensus of 15.5%. Management noted that demand remains strong, particularly for international.
Weaknesses
- The worst performing airline stock for the week was Azul, down 9.5%. Boeing has paused deliveries of 737 MAX variants with the exception of the 737-9, and it’s slowing production of the aircraft family—a result of a part nonconformance from Spirit AeroSystems. The exact issue relates to two fittings that join the aft fuselage, which were not attached correctly.
- Air freight flight activities (dedicated freighters) declined 3.0% year-over-year in March globally. This is the 12th consecutive year-over-year decline. The pace of decline moderated relative to the prior three months, albeit it appears that a China reopening-driven strength on Asian routes supported the sequential improvement. Seasonally adjusted datasets suggest that demand trends in air freight have remained weak.
- Alaska Air reported a March quarter adjusted loss per share of $0.62, falling short of FactSet consensus of $0.48. The miss was primarily due to higher operating costs, with unit costs ex-fuel at the midpoint of the company’s outlook, but capacity at the high end of the guide.
Opportunities
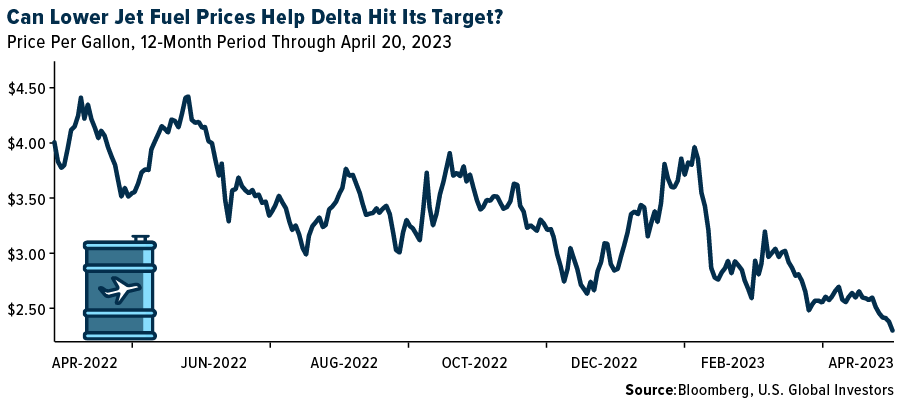
- According to Morgan Stanley, if jet fuel holds at current levels, Delta Air Lines should be able to achieve its 2024 EPS target of $7 EPS this year. Morgan believes the next long-term target could be $10 EPS in three years. At a historical 8-10 times earnings, this implies Delta should be a $65-$70 stock today and, potentially, $100+ in two years.
- Although demand and freight rates on container transportation are currently following steep downward trajectories, carriers have maintained their appetite for new vessels. The orderbook for new builds, measured against the size of existing fleets, is the biggest on record. Box carriers currently have new capacity of a stunning 7.54 million twenty-foot equivalent units (teu) in the orderbook, equivalent to 28.9% of the existing container fleet, writes shipping organization Bimco.
- A proprietary model by Morgan Stanley indicates a faster recovery in revenue per passenger kilometers (RPK) data and a noticeable upward trend. The latest forecast by the Forward Leading Indicator Traffic Estimate (FLITE), a short-term leading indicator of U.S. domestic air travel, predicts that RPKs will recover faster than they had originally predicted. This is mostly due to the fact that RPK data in February turned out to be better than the FLITE index predicted one month ago. It is important to note that RPK data is released on a two-month lag.
Threats
- According to Credit Suisse, 737 final assembly rate math suggests downside to its 2023 delivery forecast of 56 aircraft and could potentially take its 2023 delivery estimate from 459 737s to 403, down 12% and at the low-end of guidance for 400-450.
- Parked freighters in the last 12 months have now risen to 12% of total freighter fleet in April and increased from 175 to 414 parked aircraft since the beginning of 2022. This implies slowing consumer demand and, more broadly, a slowdown in the global economy. Further, the return of commercial travel has led to rebounding belly freight capacity, which has minimized the need for freight aircraft.
- According to J.P Morgan, United affirmed its $10-$12 full-year earnings expectation, predicated on flattish ex-fuel cost per available seat mile (CASM) and high-teens capacity growth. The investment banks is already there on those two metrics, with 17.7% growth and +0.4% ex-fuel CASM (after incorporating the higher second-quarter cost guide). But its earlier $7.15 EPS only rises to $7.34 versus the $8.67 consensus—both short of United’s $11 midpoint guide.
Luxury Goods and International Markets
Strengths
- China’s economy grew at the fastest pace in a year in the first quarter led by a surge in consumer spending and a pick-up in factory output. Year-over-year gross domestic product (GDP) was reported at 4.5% vs. consensus of 4% and above the fourth-quarter growth of 2.9%. China also reported stronger-than-expected retail sales, supported by market reopening after the government ended its zero-covid policy.
- BofA Global Research raised its forecast for China’s 2023 GDP growth to 6.3% from 5.5%. Its research team is betting strong performance of the luxury sector on China’s recovery, predicting that the luxury sector will grow 14% this year and 8% out of the total of 14% will be attributable to China’s reopening story. The year-to-date luxury equity outperformance was due to strong demand, and earning revisions will follow in the second half of the year.
- Melco Resorts & Entertainment, a casino and gaming company, was the best-performing S&P Global Luxury stock for the week, gaining 11.6%. Macau hotel and casino stocks gained, supported by optimism about China’s continued recovery post-pandemic.
Weaknesses
- According to Bloomberg, Tesla’s operating margins shrank to 11.4% in the first quarter, roughly a two-year low, after the company marked down its electric cars in January and March. Revenue rose 24% to $23.3 billion in the first quarter, in line with analysts’ estimates of $23.35 billion, but free cash flow (FCF) slumped to a two-year low of $441 million.
- The Philadelphia Fed Business Outlook weakened. The index was reported at a negative 31.3 vs. consensus for a negative 20.0 and March’s negative 23.2. It was the lowest monthly reading since May 2020. New orders and shipments components rose month-over-month, but they remained negative. In the job market, weekly initial jobless claims came in at 245,000, just below forecasts for 240,000 and last week’s 240,000 (revised up from 239,000). Continuing claims registered 1,865,000 in the latest week, higher than the consensus for 1,850,000 and the prior week’s 1,804,000. This was the highest weekly level since November.
- MYT Netherlands Parent, which operates the e-commerce website Mytheresa and sells luxury fashion items, was the worst-performing S&P Global Luxury stock for the second week in a row, losing 26.3% in the past five days. Shares sold off after the company reported weaker quarterly results and cut its yearly forecast.
Opportunities
- Space balloon startup Zephalto has partnered with the French space agency and will offer trips to the stratosphere. Passengers will have a chance to rise 25 kilometers (15.5 miles) in balloons filled with helium or hydrogen for one and a half hours. The company is planning to make 60 flights per year, and it will cost 120,000 EUR ($132,000) per person.
- Formula 1 racing is scheduled to take place on Sunday, May 7, at the Miami International Autodrome in Florida. Ticket prices on the official race website start at $880 for three-day passes. Racing fans spend an average of $1,1940 per person at the race, double what the typical Miami tourist spends, according to Front Office Spends.
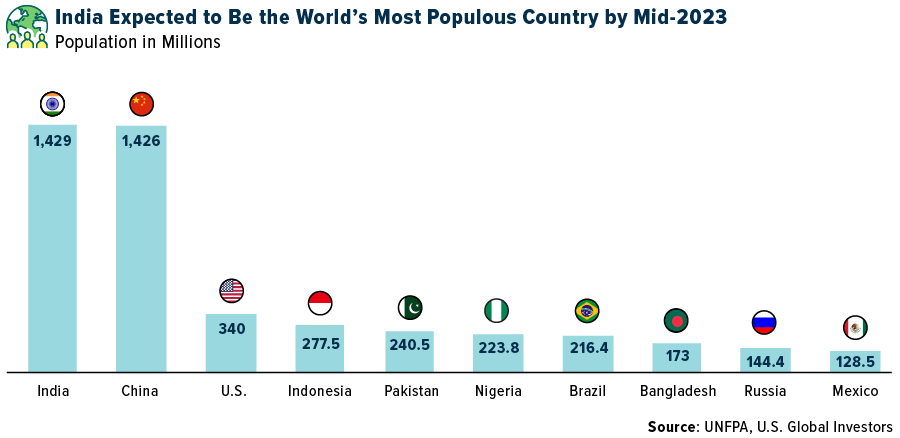
- India has overtaken China as the world’s most populated country, with a population of 1.428 billion, compared with China’s 1.425 billion. India’s population is forecasted to reach 1.668 billion by 2050, while China’s is likely to contract to around 1.317 billion, FactSet reported.
Threats
- Analysts are predicting that Kering will not report as strong quarterly results as its luxury peers. Gucci may be the weak link for the company, needing more time to reposition, as it’s heavily exposed to China where traffic plummeted in December due to closings. The company is scheduled to report on the first quarter next week, April 25.
- Luxury brands are betting on their further recovery this year in China, and it continues reopening, but it may not be as bright as expected. China set a growth target of around 5% for 2023, but geopolitical tensions are on the rise. Treasury Secretary Janet Yellen called Thursday for fair competition and growth with China. The threat of sanctions on China is looming if China continues to support Russia’s war in Europe. The country was recently accused of selling drones to Russia, but China has denied the accusations.
- According to Bloomberg, food prices have risen dramatically across Europe in recent months, jumping 19.6% in March from a year earlier, and became the main diver of inflation as energy costs have fallen. Prices in Hungary surged more than 45% over the year, according to the eurozone statistics office Eurostat, far surpassing the highest figure of just over 29% in Slovakia. Hungary’s overall inflation rate is 25.6%, the highest in the eurozone. Poland, Hungary, Slovakia and Bulgaria recently banned grain imports from Ukraine, and this move could push food prices higher.

Energy and Natural Resources
Strengths
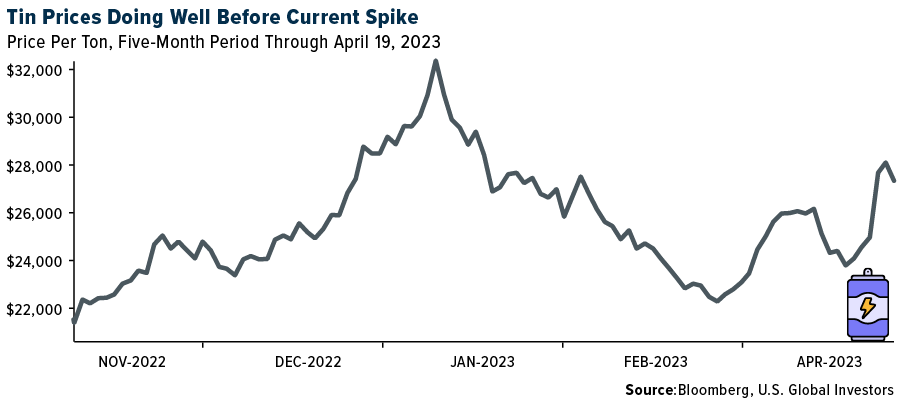
- The best-performing commodity for the week was tin, rising 9.01%. Tin jumped the most in nine months after a key mining region in Myanmar, the world’s third-biggest supplier, moved to curtail digging of the material used in electronics and cans. An economic planning committee in a northern area of the country controlled by the United Wa State Army — Myanmar’s largest ethnic armed organization — ordered a general to halt mining operations, according to the International Tin Association. The ITA cited an April 15 notice from the committee, which also said producers with valid contracts can continue until August 1.
- A total of 4,439 drilling permits were issued over March, a whopping 1,510 more than the previous month. Losses were reported only in the Utica, which fell to 39. Relevant increases were reported in the Permian, the Powder River Basin, the Eagle Ford and in smaller plays. The Permian holds a 36% share of all issued permits this month, followed by small plays with a 15% share, the Powder River Basin at 12% and the Eagle Ford at 11%.
- Last week, the Environmental Protection Agency (EPA) released its “strongest ever” vehicle emissions standards to boost U.S. electric vehicle (EV) sales. The EPA released its proposed regulations of light- and medium-duty vehicle tailpipe carbon and greenhouse gas (GHG) emissions that would limit emissions to 82 grams per mile on average across a company’s production by model year 2032, representing a 56% reduction from the 2026 target. The rules are intended to accelerate EV adoption and sales, and the EPA projects EVs could account for 67% of new vehicle sales in 2032.
Weaknesses
- The worst-performing commodity for the week was West Texas Intermediate (WTI) crude oil, dropping 5.63%, nearly wiping out almost all the gains that arose from the OPEC+ surprise cut in oil production on continued signs of economic weakness. Metallurgical coal prices declined 7.2% this week as FOB Australia PLV fell to $265.50 per ton. Met coal is down 21.4% over the past month and down 9.8% year-to-date. Met coal prices continued to slide this week as demand remains weak. Steel margins in the negative have limited further met coal purchases despite strong consumption at the mills. On the supply side, shipments out of Queensland increased 15% week-over-week, while supply from North America and Russia continues to be strong.
- Global steel production totaled 142.3 million tons in February, down 1.0% year-over-year and 8.4% month-over-month. Chinese output increased 5.6% year-over-year but decreased 9.7% month-over-month to 80.0 million tons. Production in the European Union (EU) was down 12.6% year-over-year to 10.5 million tons. South Korea output amounted to 5.2 million tons, up 1.1% year-over-year.
- Iron ore edged lower as investors weighed weak steel demand in China along with the re-opening of a key export port in Australia. Prices of the steel-making ingredient fell as much as 1.9% as demand in China remains moribund, while iron ore shipments from Port Hedland quickly resumed after closing due to a cyclone. China’s steel market has been soft since the start of April, despite the onset of the nation’s usual peak building season. Stockpiles jumped 6.2% in early April, with slower sales forcing mills to offer discounts on inventories and keeping them from restocking.
Opportunities
- Installed nuclear capacity in India is set to more than triple by 2031, and nuclear power plants are likely to generate about 9% of the country’s electricity by 2047, according to Minister of State Jitendra Singh. India’s nuclear power plants generated more than 3% of its electricity last year, despite representing only 1.6% of the country’s installed capacity.
- JPMorgan estimated that energy transition demand for refined copper will increase from 2.5 million tons this year to 8.5 million tons by 2035, registering a compound annual growth rate (CAGR) of 11%. With this growth, JPMorgan estimates the share of total refined copper demand from energy transition applications will rise from around 10% in 2023 to account for more than 25% of total demand by 2035.
- RBC estimates the Western Canadian rig count spending being much of 2022 at the upper end of its five-year range is a positive sign for continued volume growth into 2023. Further, they see a line of sight for multi-year volume growth with the LNG Canada export terminal set to come into service in the middle of the decade. Several companies expressed optimism with respect to the potential to benefit from filling up unutilized capacity as well as proceeding with new projects underpinned by long-term take-or-pay contracts.
Threats
- Chile announced its long-awaited lithium policy this week, which will give the state a majority stake in all new contracts; existing contracts would be respected but would need to be renewed upon their expiry under the new terms. SQM and Albemarle share prices tumbled on the announced change in policy. Chile has some of the biggest reserves of lithium in the world and is the second-largest producer of the material.
- Bloomberg reported that for methane emissions in the U.S., only the largest oil and gas wells producing about one-third of domestic production are required to be monitored for emissions. Unfortunately, the number of wells that meet this production hurdle account for less than 1% of all 917,000 active wells in the country. Many of these wells are older, lower-performing stripper wells, and their production only accounts for about 7% of U.S. production, but these wells emit about 28% of total methane gas emissions.
- Bloomberg sees flashing red signals in the diesel market as signs of demand weakness surface that heavy machinery orders for construction and commercial trucks to transport goods are weakening in many of the world’s largest economies. Ben Ayers, senior economist with Nationwide Economics, noted an expected drop in diesel demand is reflecting the rising recession expectations which by some estimates is currently a 65% chance of in the U.S.
Bitcoin and Digital Assets
Strengths
- Of the cryptocurrencies tracked by CoinMarketCap, the best performer for the week was OKB, rising 13.70%.
- Switzerland’s Syz Group is joining with Hong Kong-based venture capital firm CMCC Global to launch a fund with at least $50 million to invest in crypto-focused hedge funds. SyzCrest Digital will start operations on July 1, ultimately aiming to raise as much as $300 million, writes Bloomberg.
- One of the hottest NFT mints in Solana’s recent history is getting pushed into Friday after a groundswell of interest in the Madlads collection broke the internet infrastructure behind it.
Weaknesses
- Of the cryptocurrencies tracked by CoinMarketCap, the worst performing for the week was Stacks, down 16.52%.
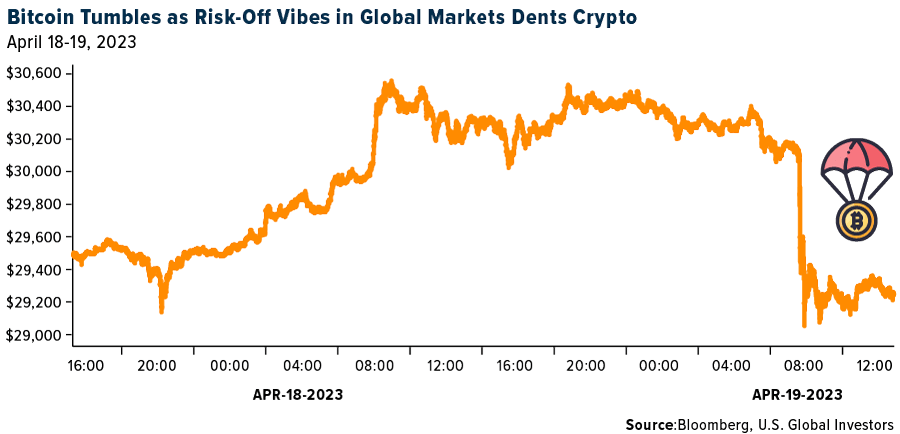
- Bitcoin dropped back below the closely watched $30,000 level. Bitcoin fell as much as 4.5% before paring some of the slide to trade at about $29,175 on Wednesday.
- A former minority owner of the NFL’s Minnesota Vikings should spend seven years behind bars and forfeit more than $740 million after admitting he helped cryptocurrency exchanges avoid money laundering rules. He pleaded guilty in April 2022 to five counts and was scheduled to be sentenced Thursday.
Opportunities
- President Donald Trump launched his second installment of the Trump Digital Trading Card series of $99 nonfungible token (NFT) cards after offering an initial series last year with depictions such as his head atop cartoon super-hero figures, writes Bloomberg.
- Bitcoin trading signal hints at an upcoming leap back above $30,000. A pattern buried in the coin’s recent swings suggests it could vault above that level again en route to a 7% short-term gain. The pattern is a minimum daily jump of 3%, followed by a next-day reversal of at least that magnitude. Bitcoin rose about 7% on average over three, five and 10 days, writes Bloomberg.
- The number of mergers and acquisitions among digital-asset firms set a quarterly record in the first three months of the year, according to Architect Partners. There were 54 transactions in the period, writes Bloomberg.
Threats
- Crypto exchange Coinbase Global may consider moving its headquarters outside the U.S. unless the country changes its approach to regulation, the CEO said. Brian Armstrong has been vocal about his opposition to current U.S. crypto regulation, raising the possibility of relocating and marking an escalation of the rhetoric, writes Bloomberg.
- Faruk Faith Ozer, the former CEO of the collapsed cryptocurrency exchange Thodex, has been extradited from Albania to Turkey to face charges of fraud and money laundering. Upon his arrival at Istanbul Airport, the 29-year-old was immediately detained by police. Thodex stopped operations about two years ago, leaving tens of thousands of customers with losses.
- Montenegro prosecutors filed an indictment for Terraform Labs co-founder Do Kwon and his chief financial officer, accusing the men of forging personal documents.

Gold Market
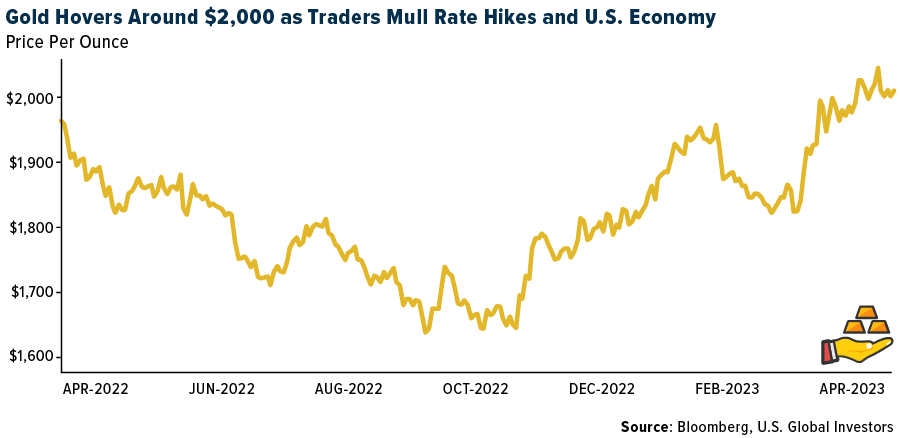
This week, gold futures closed the week at $1992.60, down $23.20 per ounce, or 1.15%. Gold stocks, as measured by the NYSE Arca Gold Miners Index, ended the week higher/lower by 4.42%. The S&P/TSX Venture Index came in off 3.71%. The U.S. Trade-Weighted Dollar gained just 0.15%.
Strengths
- The best-performing precious metal for the week was platinum, up 8.16%, while palladium closely trailed with a 7.30% gain. Analysts pointed to the better-than-expected first-quarter GDP gain in China for the strength in platinum group metals (PGMs) with auto sales expected to rise. Gold edged higher after ending last week with a steep loss on stronger-than-expected U.S. inflation data that boosted bets on more monetary tightening. The precious metal traded above $2,000 an ounce Monday, when data showed U.S. near-term inflation expectations unexpectedly surging in early April.
- Central bank buying continued in February with global gold reserves up by 52 tons, higher for the 11th consecutive month. January and February net purchases totaled 125 tons, the strongest start to a year since 2010. Last week, the People’s Bank of China (PBOC) reported a further increase in its gold reserve holdings with March purchases of 18 tons, the fifth consecutive month of increases. China’s gold reserves now sit at 2,068 tons. The World Gold Council (WGC) continues to believe that strong central bank gold buying, which set a record in 2022, could continue, particularly owing to the metal’s investment appeal.
- The Korea Times reports that the country’s demand for gold has risen to an all-time high, as a global preference for safer assets has increased due to rising interest rates, concerns over a potential recession and the ongoing war in Ukraine with Russia. Incidentally, the Korean central bank has not added to its gold reserves for the past 10 years. Interestingly, maybe the bank is hedging that their citizens will donate their gold to pay off national debts again, like when the Asian financial crisis hit and their people donate 227 tonnes of gold to the nation to offset debts.
Weaknesses
- Gold futures for June have traded above $2,000 per ounce for the last 14 trading sessions until Friday as unexpectedly strong U.S. business activity climbed to a one-year high, forcing investors to reckon with the prospects of additional rate hikes beyond current expectations. Gold opened below $2,000 on Friday and closed as such.
- Regis Resources reported March quarter production of 103,700 ounces, a 15% miss versus consensus. RRL indicated production was driven by the slower ramp-up at Garden Well South, unplanned maintenance at Rosemont, poor underground performance at Tropicana and wet weather impacts, which have extended into April. RRL notes the non-weather-related issues have been rectified with rates returning to plan early in the June quarter.
- Not often do we get news of a gold heist, but two occurred in the past week. In one case, Vancouver-listed Patagonia Gold Corp. had its gold room broken into at its Cap-Oeste Project, in Argentina, in the early hours of April 17; burglars made off with about 500 ounces of gold, or $1 million. In another story, thieves made off with a cargo container stored at Pearson International Airport, outside of Toronto. Initially, it was reported as a $100 million heist, but police said the container contained close to $15 million in gold and other valuables. The container arrived on Monday of this week and disappeared by Thursday. Bloomberg noted gold mined in Canada often transits through Pearson to international markets.
Opportunities
- If spot commodity prices prevail, there is 54% upside risk to 12-month forward consensus earnings for the gold miners on average, with Harmony the most geared if spot commodity prices prevail. These expectations may already be reflected in the equities and they may struggle to justify further multiple expansion in the current elevated margin environment.
- Asante Gold Corp. received a bid on Thursday from Fujairah Holding LLC, its largest shareholder, at $2.20 per share. Before the offer, Asante had closed at $1.51 but climbed more than 26% on Friday. Asante rejected the offer on the basis the offer was too conditional on restricting other bidders from participating in the evaluation of the transaction. Asante has two operating mines in Ghana producing a combined 400,000 per year. After the takeover offer, it is valued at only C$723 million, compared to Orla Mining, for example, which is on track to produce 100,000 to 110,000 ounces this year in Mexico and is valued at $1.95 billion.
- According to a recent World Gold Council (WGC) study, the recent financial sector crisis was a key element behind the 9% increase in gold price through March. This was driven by lower yield rates, a weaker dollar and safe-haven buying. Investors flocked into physically-backed gold ETFs with these funds increasing their holdings by 1.33 million ounces since March 1. The yellow metal reached a 52-week high of $2,047 per ounce late yesterday but has pulled back since. This upward trend continues to have tailwinds from easing U.S. and Bank of Japan monetary policy, based on data points like falling inflation and increasing jobless claims.
Threats
- According to UBS, Barrick’s first-quarter earnings per share (EPS) will likely come in below Wall Street estimates. Based on details released in the preliminary production report, the bank calculates EPS of $0.09 per share, versus consensus of $0.18 per share. Compared to Visible Alpha, first-quarter gold production volumes of 952,000 ounces were 4% below the Street’s 991,000 ounces on implied cash costs of $990 per ounce versus consensus of $876 per ounce.
- Barrick’s total cash costs and all-in sustaining costs (AISC) are expected at $1,008 per ounce and $1,358 per ounce, respectively, 22% and 8% higher, respectively, than 2022 fourth quarter and 14% and 13% higher than 2022 first quarter. The company could have inflationary pressure on costs to ease later into the year, as inflation is showing some signs of relief.
- The large-cap streamers (Franco Nevada and Wheaton Precious Metals) may have a weak first quarter, given the timing of shipments, a ramp-up in assets and better grades expected later in the year. The streamers will address the 15% global minimum tax proposal (GMT) that was included in the Canadian federal budget.


U.S. Global Investors, Inc. is an investment adviser registered with the Securities and Exchange Commission (“SEC”). This does not mean that we are sponsored, recommended, or approved by the SEC, or that our abilities or qualifications in any respect have been passed upon by the SEC or any officer of the SEC.
This commentary should not be considered a solicitation or offering of any investment product. Certain materials in this commentary may contain dated information. The information provided was current at the time of publication. Some links above may be directed to third-party websites. U.S. Global Investors does not endorse all information supplied by these websites and is not responsible for their content. All opinions expressed and data provided are subject to change without notice. Some of these opinions may not be appropriate to every investor.
Holdings may change daily. Holdings are reported as of the most recent quarter-end. The following securities mentioned in the article were held by one or more accounts managed by U.S. Global Investors as of (03/31/23):
easyJet PLC
United Airlines Holdings Inc.
The Boeing Co.
Alaska Air Group Inc.
Delta Air Lines Inc.
Hermes International
LVMH Moet Hennessy Louis Vuitton SA
Air France-KLM
Deutsche Lufthansa AG
Ryanair Holdings PLC
International Consolidated Airlines Group SA
Tesla Inc.
Kering SA
Regis Resources Ltd.
Harmony Gold Mining Co. Ltd.
Asante Gold Corp.
Franco-Nevada Corp.
Wheaton Precious Metals Corp.
*The above-mentioned indices are not total returns. These returns reflect simple appreciation only and do not reflect dividend reinvestment.
The Dow Jones Industrial Average is a price-weighted average of 30 blue chip stocks that are generally leaders in their industry. The S&P 500 Stock Index is a widely recognized capitalization-weighted index of 500 common stock prices in U.S. companies. The Nasdaq Composite Index is a capitalization-weighted index of all Nasdaq National Market and SmallCap stocks. The Russell 2000 Index® is a U.S. equity index measuring the performance of the 2,000 smallest companies in the Russell 3000®, a widely recognized small-cap index.
The Hang Seng Composite Index is a market capitalization-weighted index that comprises the top 200 companies listed on Stock Exchange of Hong Kong, based on average market cap for the 12 months. The Taiwan Stock Exchange Index is a capitalization-weighted index of all listed common shares traded on the Taiwan Stock Exchange. The Korea Stock Price Index is a capitalization-weighted index of all common shares and preferred shares on the Korean Stock Exchanges.
The Philadelphia Stock Exchange Gold and Silver Index (XAU) is a capitalization-weighted index that includes the leading companies involved in the mining of gold and silver. The U.S. Trade Weighted Dollar Index provides a general indication of the international value of the U.S. dollar. The S&P/TSX Canadian Gold Capped Sector Index is a modified capitalization-weighted index, whose equity weights are capped 25 percent and index constituents are derived from a subset stock pool of S&P/TSX Composite Index stocks. The NYSE Arca Gold Miners Index is a modified market capitalization weighted index comprised of publicly traded companies involved primarily in the mining for gold and silver. The S&P/TSX Venture Composite Index is a broad market indicator for the Canadian venture capital market. The index is market capitalization weighted and, at its inception, included 531 companies. A quarterly revision process is used to remove companies that comprise less than 0.05% of the weight of the index, and add companies whose weight, when included, will be greater than 0.05% of the index.
The S&P 500 Energy Index is a capitalization-weighted index that tracks the companies in the energy sector as a subset of the S&P 500. The S&P 500 Materials Index is a capitalization-weighted index that tracks the companies in the material sector as a subset of the S&P 500. The S&P 500 Financials Index is a capitalization-weighted index. The index was developed with a base level of 10 for the 1941-43 base period. The S&P 500 Industrials Index is a Materials Index is a capitalization-weighted index that tracks the companies in the industrial sector as a subset of the S&P 500. The S&P 500 Consumer Discretionary Index is a capitalization-weighted index that tracks the companies in the consumer discretionary sector as a subset of the S&P 500. The S&P 500 Information Technology Index is a capitalization-weighted index that tracks the companies in the information technology sector as a subset of the S&P 500. The S&P 500 Consumer Staples Index is a Materials Index is a capitalization-weighted index that tracks the companies in the consumer staples sector as a subset of the S&P 500. The S&P 500 Utilities Index is a capitalization-weighted index that tracks the companies in the utilities sector as a subset of the S&P 500. The S&P 500 Healthcare Index is a capitalization-weighted index that tracks the companies in the healthcare sector as a subset of the S&P 500. The S&P 500 Telecom Index is a Materials Index is a capitalization-weighted index that tracks the companies in the telecom sector as a subset of the S&P 500.
The Consumer Price Index (CPI) is one of the most widely recognized price measures for tracking the price of a market basket of goods and services purchased by individuals. The weights of components are based on consumer spending patterns. The Purchasing Manager’s Index is an indicator of the economic health of the manufacturing sector. The PMI index is based on five major indicators: new orders, inventory levels, production, supplier deliveries and the employment environment. Gross domestic product (GDP) is the monetary value of all the finished goods and services produced within a country’s borders in a specific time period, though GDP is usually calculated on an annual basis. It includes all private and public consumption, government outlays, investments and exports less imports that occur within a defined territory.
The S&P Global Luxury Index is comprised of 80 of the largest publicly traded companies engaged in the production or distribution of luxury goods or the provision of luxury services that meet specific investibility requirements.
The Citi Economic Surprise Indices measure data surprises relative to market expectations. A positive reading means that data releases have been stronger than expected and a negative reading means that data releases have been worse than expected.
The Shanghai Containerized Freight Index (SCFI) reflects the spot rates of Shanghai export container transport market. It includes both freight rates of 15 individual shipping routes and a composite index.
The STOXX Europe 600 Index is derived from the STOXX Europe Total Market Index (TMI) and is a subset of the STOXX Global 1800 Index. With a fixed number of 600 components, the STOXX Europe 600 Index represents large, mid and small capitalization companies across 17 countries of the European region.
The CAC 40 is a free-float market capitalization-weighted index that reflects the performance of the 40 largest and most actively traded shares listed on Euronext Paris, and is the most widely used indicator of the Paris stock market.
The Freightos Baltic Index (FBX) provides 40′ container (FEU) indices for ocean freight. The FBX flagship index is a weighted average of the twelve underlying regional route indexes. Each individual index trade lane is represented by 5-7 of the major ports of each region.
The Philadelphia Fed Report, formally known as the Business Outlook Survey and sometimes abbreviated as BOS, is a monthly survey produced by the Federal Reserve Bank of Philadelphia which questions manufacturers on general business conditions.
