
Central Banks Gobbled Up More Gold Last Year Than in Any Year Since 1967
The price of gold stopped just short of hitting $1,960 an ounce last Thursday, its highest level since April 2022, before plunging below $1,900 on Friday following a stronger-than-expected U.S. jobs report, indicating that the current rate hike cycle may be far from over.
I don’t believe that this takes away from the fact that gold posted its best start to the year since 2015. The yellow metal rose 5.72% in January, compared to 8.39% in the same month eight years ago.
I also maintain my bullishness for gold and gold mining stocks in 2023. Gold was one of the very few bright spots in a dismal 2022, ending the year essentially flat, and I expect its performance to remain strong in the year ahead.
Record Retail Demand in 2022
The big headline in the World Gold Council’s (WGC) 2022 review is that total global demand expanded 18% year-over-year, reaching its highest level since 2011.
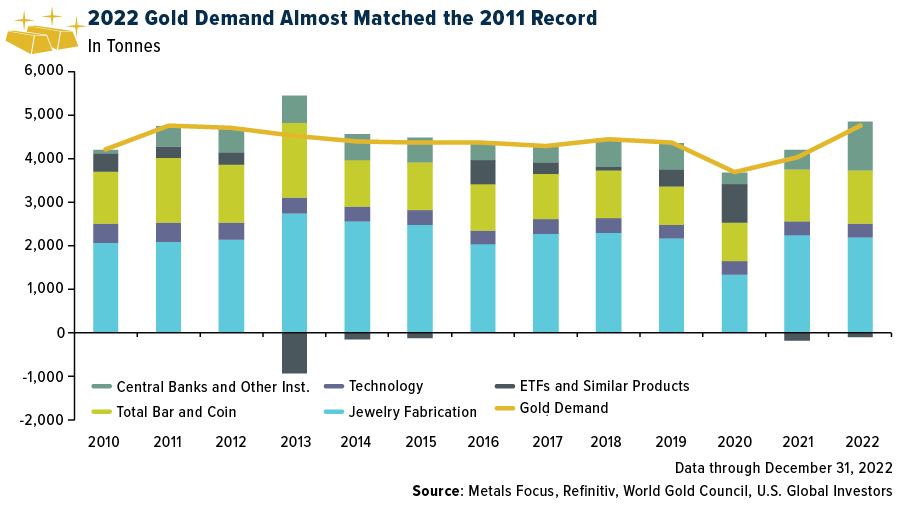
Central banks were responsible for much of the growth, adding a massive 1,136 metric tons, the largest annual amount since 1967. China began accumulating again in 2022 for the first time in three years, continuing its goal of diversifying away from the dollar.
Meanwhile, retail demand for bars and coins in the U.S. and Europe hit a new annual record last year in response to stubbornly high inflation and the war in Ukraine. Western investors gobbled up 427 tons (approximately 15 million ounces), the most since 2011.
Investors to Shift from Physical Bullion to Gold-Backed ETFs in 2023?
Where I see the opportunity is with gold-backed ETFs and gold mining stocks, both of which didn’t see the same level of demand as the bullion market last year. Investors withdrew some 110 tons from physical gold ETFs, the second straight year of declines, though at a slower pace compared to 2021. Even when the gold price began to climb in November, investors didn’t seem to respond as they have in past rallies.
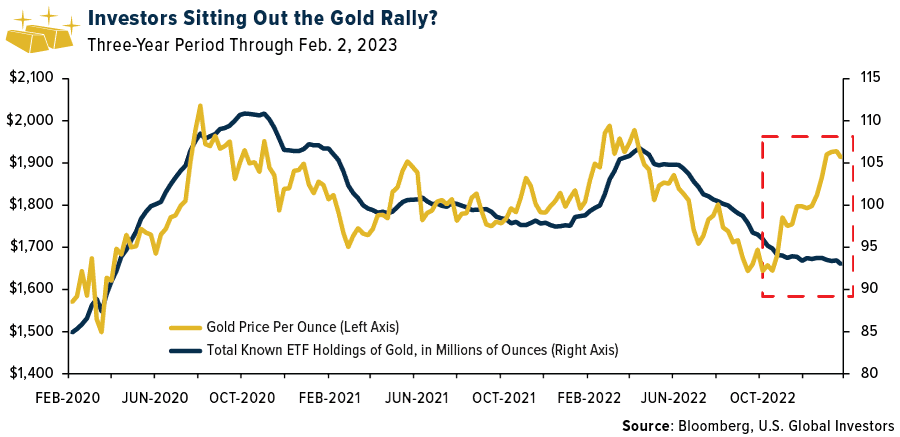
The WGC suggests that demand for ETFs that hold physical gold will “take the baton” from bars and coins this year. That remains to be seen, but I always recommend that investors diversify, with 5% of their portfolio in bullion, gold jewelry and gold-backed ETFs.
Another 5% can be allocated to high-quality gold mining stocks, mutual funds and ETFs. We prefer companies that have demonstrated strong momentum in revenue, free cash flow and high-growth margins on a per-share basis.
$1 Trillion Investment in the Energy Transition, on Par with Fossil Fuels
If I had to select another metal to watch this year (and beyond), it would be copper. The red metal, we believe, will be one of the greatest beneficiaries of the global low-carbon energy transition that’s taking place. As we seek to electrify everything, from power generation to transportation, copper is the one material that’s used every step of the way.
What’s more, investment in the transition is accelerating. Last year, more than $1 trillion was plowed into new technologies such as renewable energy, energy storage, carbon capture and storage, electrified transport and more.
Not only is this a new annual record amount, but, for the first time ever, it matches what we invested in fossil fuels, according to Bloomberg New Energy Finance (NEF).
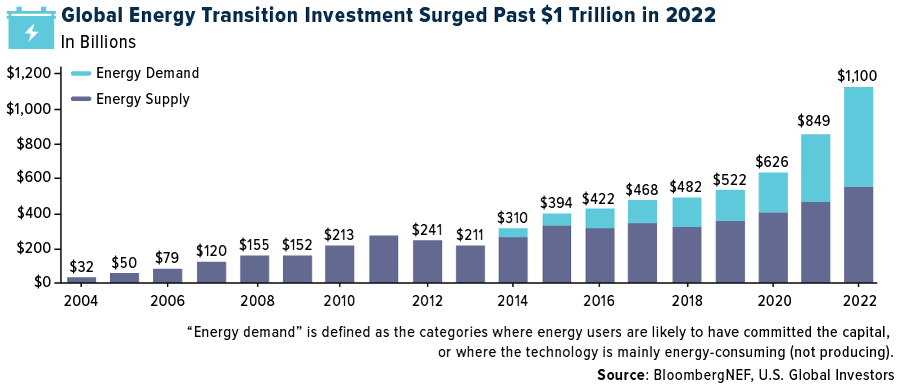
China was the top investor, responsible for $546 billion, or nearly half of the total amount. The U.S. was a distant second at $141 billion, though the Inflation Reduction Act (IRA), signed into law in August 2022, has yet to be fully deployed.
Copper’s Supply-Demand Imbalance
At the same time that copper demand is growing due to the energy transition, the global supply pipeline is thinning due to shrinking exploration budgets and a dramatic slowdown in the number of new deposits.
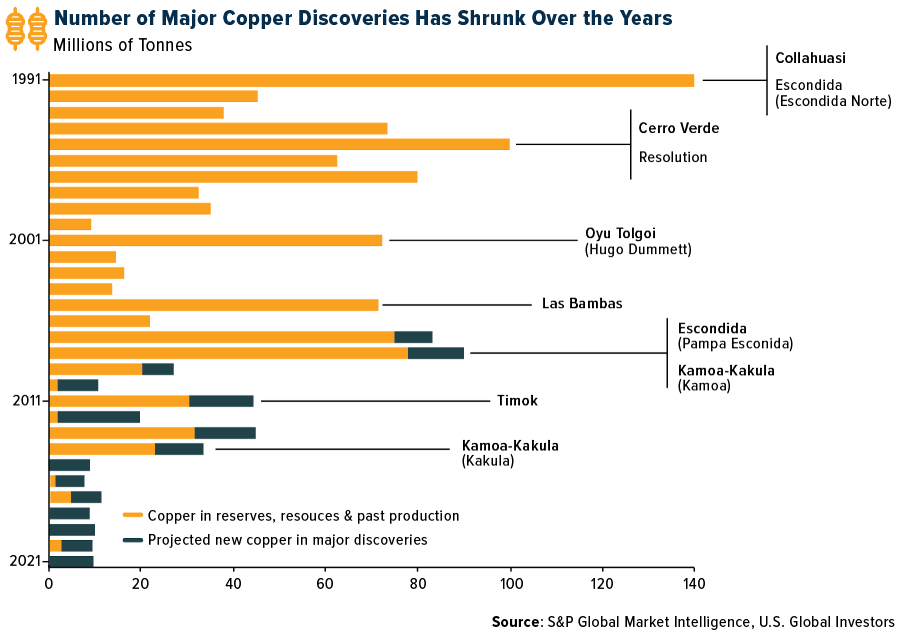
Take a look at the chart above, courtesy of S&P Global. Copper exploration budgets have not managed to generate a meaningful increase in major new discoveries. According to S&P Global, most of the copper that’s produced every year comes from assets that were discovered in the 1990s.
It may be a good time to consider getting exposure with a high-quality copper miner such as Ivanhoe Mines or a broad-based commodities fund that gives you access to copper exploration and production.
UPCOMING WEBCAST
Please join me for a webcast to discuss how airlines are performing and ways to incorporate this industry into your portfolio! The webcast will take place on Tuesday, February 14, at 1:00pm Central time. Save your spot by emailing info@usfunds.com with the subject line “airlines ETF.”
All opinions expressed and data provided are subject to change without notice. Some of these opinions may not be appropriate to every investor. By clicking the link(s) above, you will be directed to a third-party website(s). U.S. Global Investors does not endorse all information supplied by this/these website(s) and is not responsible for its/their content.


