Base Metals Get Supercharged Thanks to China Rebound
At the very heart of this rally is rapidly strengthening factory activity around the globe. The big standout is China, the only major economy to see a robust recovery following the pullback that was triggered by the coronavirus pandemic.

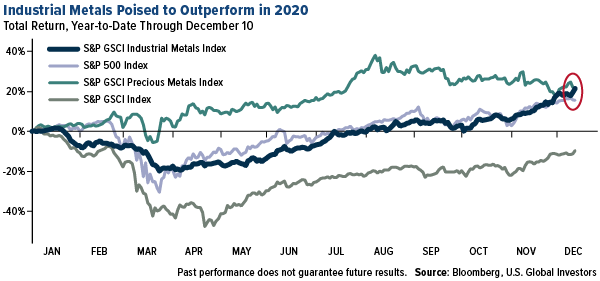
Industrial metals are well on their way to being among the top performers of 2020, supported by red hot demand from China and global supply concerns.
As of Friday, the MSCI Industrial Metals Index—which tracks the price of copper, nickel, aluminum and more—was up 21.4% year-to-date, just below the index of precious metals, up 21.9%. The broader S&P GSCI, which measures metals as well as agricultural and energy-related commodities, was underwater by nearly 10%.
As I’ve already discussed, copper prices have been on a tear this year thanks not only to the economic strength of China, the metal’s biggest consumer, but also because of its essential role in nascent technologies such as electric vehicles (EVs) and renewable green energy.
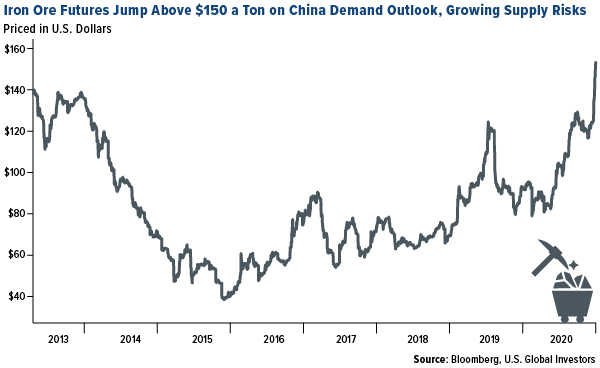
The very hottest major commodity, however, has been iron ore. Used to make steel, the metal has increased nearly 70% in 2020, with iron futures trading on the Singapore Exchange topping $155 per metric ton Friday for the first time since the contract came online in 2013.
At the very heart of this rally is rapidly strengthening factory activity around the globe. In November, a number of countries’ manufacturing sectors were in expansion mode, according to the monthly purchasing manager’s index (PMI), which is a leading indicator for demand.
But the big standout is China, the only major economy to see a robust recovery following the pullback that was triggered by the coronavirus pandemic.
The U.S., by comparison, is rebounding nicely, but it still has a long way to go before it reaches pre-pandemic levels. As of November, the number of jobs in the country was still below the February peak by nearly 10 million.
Plenty of Gas in the Tank
I believe the rally is only getting started, and we could see ever higher asset prices in 2021, for a couple of significant reasons.
Number one, President-elect Joe Biden plans to make infrastructure one of his top priorities soon after taking office next month. Proposals have the U.S. spending as much as $2 trillion not only to improve roads, bridges and seaports but also beef up the EV sector, add charging stations, convert school buses to zero emissions and more.
Biden’s plans could attract private investment in infrastructure, including from pension and insurance investment funds, according to Reuters. This, in turn, could prop up the base metals market.
The second big reason has to do with inflation driven by additional stimulus packages and money-printing. Last week, legendary Bridgewater Associates money manager Ray Dalio held an “Ask Me Anything” event on Reddit, during which he said that the “flood of money and credit” was unlikely to recede next year. As such, “assets will not decline when measured in the depreciating value of money,” the billionaire investor suggested.
All that money will need to go somewhere, in other words, and that includes base metals and other commodities.
Congress is currently considering a $908 billion stimulus bill that’s supported by the White House. According to Barron’s, the International Monetary Fund (IMF) chief economist Gita Gopinath is urging Congress to pass the relief package even at the risk of heating up inflation, which would be supportive of commodities.
Remember, the Federal Reserve seems no longer interested in containing inflation. In August, Fed Chair Jerome Powell unveiled a new policy approach that would allow inflation to average 2% over time, meaning price spikes month-to-month would be tolerated.
Emerging Markets: “The Most Important Chart” as We Head Into 2021
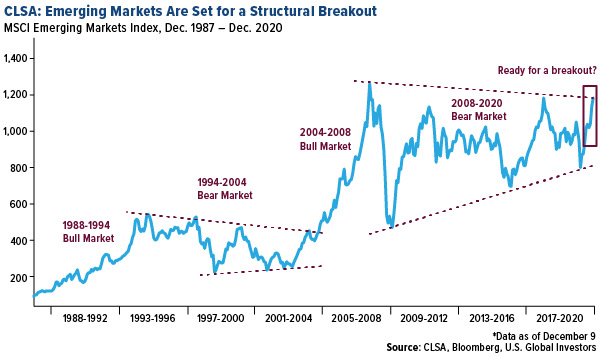
Besides base metals, I’m also bullish on emerging markets. Below is a chart that CLSA calls “the most important chart for global investors to pay attention to as we go into 2021.”
In a report dated December 10, analysts at the Hong Kong-based financial firm write that they see emerging markets (EMs) offering the “greatest opportunity” next year. If you take a look at the chart, you can see that the EM universe, as measured by the MSCI Emerging Markets Index (MXEF), is currently testing resistance that goes back to late 2007.
If a breakout occurs, CLSA says, it would be “similar to the recognition phase in 2004 following the 1994 – 2004 secular bear market pattern.” To give you some idea of the returns EM investors may have seen at the time, the MXEF increased over 200% in the four-year period ended December 31, 2007.
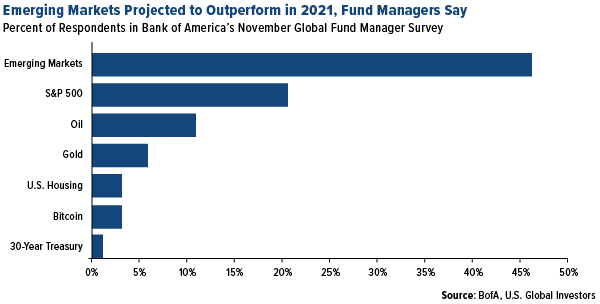
Looking ahead to 2021, I agree with CLSA and others in believing EMs look well-positioned to outperform, particularly now that a few different COVID-19 vaccine candidates are becoming available. In November, close to half of fund managers participating in a Bank of America survey said they believe emerging markets are poised to outperform next year, ahead of the S&P 500, oil and gold.
Meanwhile, JPMorgan points out that EMs are currently under-owned on a relative basis, and that after being largely ignored by investors this year, they could rally as much as 20% in 2021.
Attractive Dividend Yields
The EM investment case is strengthening even more as the U.S. has joined Europe and Japan in offering near-zero or even negative real yields. More than 75% of all debt issued by governments in developed markets (DMs) now trades at a negative real yield, according to JPMorgan.
This phenomenon isn’t reserved just for government debt, though. For the first time ever, investment-grade corporate debt in the U.S. trades with an effective real yield of 0%, the Wall Street Journal reports.
This is forcing yield-starved investors to seek alternatives.
EMs could be such an alternative. Some of the most attractive dividend yields are offered by stocks listed in emerging economies, particularly those in Central and Eastern Europe (CEE). For the year so far, dividend yields for Russian stocks, as measured by the MOEX Russia Index, have averaged 6.5%. That’s nearly 3.5 times greater than the average yield offered by U.S. stocks over the same period. At only 1.9%, the yield for the S&P 500 was only a few basis points above inflation.
Undervalued Compared to U.S. Market
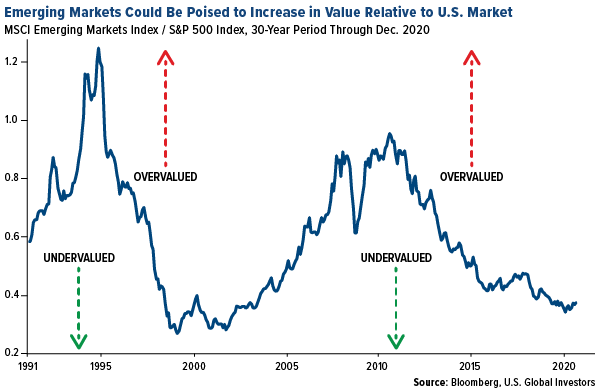
Compared to the U.S. market, EMs also appear to be undervalued, making now an exciting entry point. The chart below shows you the ratio between the MSCI Emerging Markets Index and S&P 500. As you can see, EM stocks are more undervalued on a relative basis now than at any other time since the early 2000s.
HIVE a Crypto Proxy
Many of you listened in to the recent HIVE Blockchain Technologies webcast, where we reported record revenue and cash flow for the second quarter of fiscal 2021. I mentioned that investors are trading HIVE as a proxy for the cryptocurrencies it mines, primarily Ethereum and Bitcoin.
Last week, the popular Motley Fool investment advice website recommended HIVE for that very reason.
“You can directly purchase and hold Bitcoin in your portfolio. But for most investors, this may be too technical or too risky,” the site writes. Instead, it says, you could bet on HIVE, the first publicly traded crypto-mining firm.
HIVE “is a convenient proxy for cryptocurrency exposure,” Motley Fool adds.
Shares of the company are up close to 1,270% for the year.
Looking for tips on buying airline stocks? Watch my most recent educational video by clicking here! Be sure to like and subscribe.
All opinions expressed and data provided are subject to change without notice. Some of these opinions may not be appropriate to every investor. By clicking the link(s) above, you will be directed to a third-party website(s). U.S. Global Investors does not endorse all information supplied by this/these website(s) and is not responsible for its/their content.
Frank Holmes has been appointed non-executive chairman of the Board of Directors of HIVE Blockchain Technologies. Both Mr. Holmes and U.S. Global Investors own shares of HIVE. Effective 8/31/2018, Frank Holmes serves as the interim executive chairman of HIVE.
The S&P 500 Stock Index is a widely recognized capitalization-weighted index of 500 common stock prices in U.S. companies. The Purchasing Manager’s Index is an indicator of the economic health of the manufacturing sector. The PMI index is based on five major indicators: new orders, inventory levels, production, supplier deliveries and the employment environment. The S&P GSCI Industrial Metals Index provides investors with a reliable and publicly available benchmark for investment performance in the industrial metals market. The S&P GSCI Precious Metals Index provides investors with a reliable publicly available benchmark for investment performance in the precious metals market. The S&P GSCI serves as a benchmark for investment in the commodity markets and as a measure of commodity performance over time. The MSCI Emerging Markets Index is a free-float weighted equity index that captures large and mid-cap representation across Emerging Markets (EM) countries. The index covers approximately 85% of the free float-adjusted market capitalization in each country. MOEX Russia Index is a cap-weighted composite index calculated based on prices of the most liquid Russian stocks of the largest and dynamically developing Russian issuers presented on the Moscow Exchange. The dividend yield, expressed as a percentage, is a financial ratio (dividend/price) that shows how much a company pays out in dividends each year relative to its stock price. There is no guarantee that the issuers of any securities will declare dividends in the future or that, if declared, will remain at current levels or increase over time.


