


What If We’re Measuring Inflation All Wrong?
Date Posted: March 26, 2021
Read time: 49 min
Inflation is top of mind right now for many consumers, businesses and investors. Responding to a recent Bank of America survey, asset managers around the world agreed that inflation is the number one market risk, displacing COVID-19 for the first time since February 2020.
By Frank Holmes
CEO and Chief Investment Officer
U.S. Global Investors

Inflation is top of mind right now for many consumers, businesses and investors. Responding to a recent Bank of America survey, asset managers around the world agreed that inflation is the number one market risk, displacing COVID-19 for the first time since February 2020.
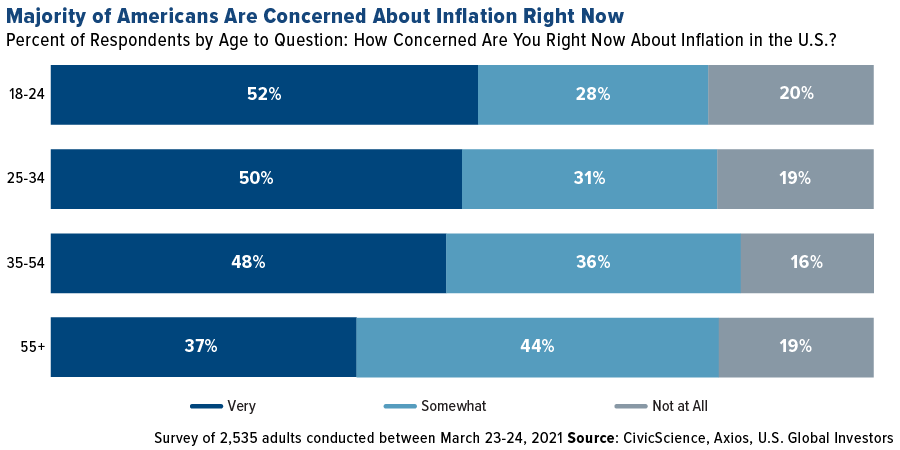
Another survey conducted this month found that over three quarters of Americans were either “very” or “somewhat” concerned about inflation. Perhaps not surprisingly, younger Americans who have not yet reached their peak earning years were most worried.
Loyal readers know I’ve been writing about this topic a lot lately. There are many signs that inflation is already here: Commodity prices are up. Home prices are up. Energy prices are up. Shipping rates are way up. Used cars and trucks are through the roof.
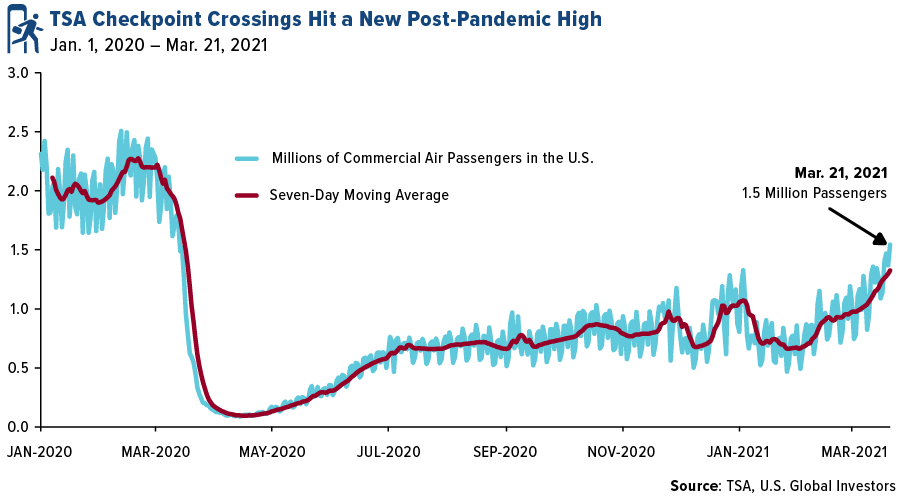
And the trend is only going to accelerate as social distancing is relaxed and the economy steadily returns to “normal.” This week, the Department of Labor reported that initial jobless claims fell to their lowest level in a year. Last Sunday, 1.5 million people boarded commercial flights, the most since lockdowns began.
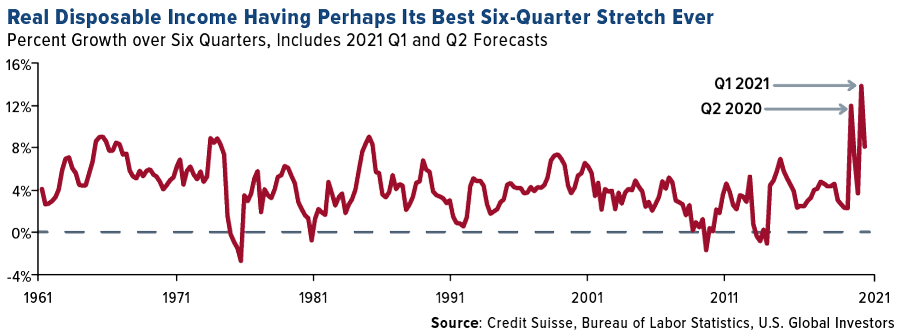
Thanks to “stimmy” checks and unprecedented money printing, real disposable income is set to have its biggest increase ever in any given six-quarter period, says Credit Suisse. The firm expects U.S. consumption to surge an “extreme” 10% this year, triggering a significant jump in new orders and new hiring—all of which is highly inflationary. This month, in fact, U.S. manufacturers reported the sharpest rise in new orders since 2014, according to IHS Markit.
The Pandemic May Have Made the CPI Obsolete
My question, as always, is whether we’re measuring inflation accurately. What if we’re doing it all wrong? As investors, we want to make decisions based on the best available data, so what should we do if the data is incomplete or flawed?
Here in the U.S., inflation is measured by the consumer price index (CPI), which is updated monthly by the Bureau of Labor Statistics (BLS). The standard way BLS researchers do this is to literally visit stores and ask them for prices.
This approach might seem intuitive, but a recent Bloomberg article lists two fundamental problems.
Number one, the CPI is based on a basket of goods and services that Americans may have spent money on in the past but whose sales suffered during the pandemic. Think entertainment and recreation, restaurants and hotels, new clothes and more.
And two, with thousands of stores and businesses closed over the past year, researchers haven’t been able to make in-person visits, leaving gaping holes in the data. A whole lot of shopping moved online in 2020—as much as $105 billion, according to one estimate—where month-to-month price volatility can be far greater and more rapid.
 As International Monetary Fund (IMF) economist Marshall Reinsdorf recently put it: “Spending patterns changed abruptly, and the CPI weight suddenly became obsolete” (emphasis my own).
As a result, there may be a huge amount of inflation that simply isn’t being detected.
The BLS is allegedly considering adjustments to its methodology to account for changing spending habits and preferences—which is one way of admitting that the data it produces is skewed.
But in the meantime, what do we as investors do? One source I’ve turned to again and again is Shadow Government Statistics, or ShadowStats, which provides alternate inflation data based on the pre-1980 and pre-1990 methodologies. Using these methodologies, consumer prices are increasing by 9% or faster, not 1.7%.
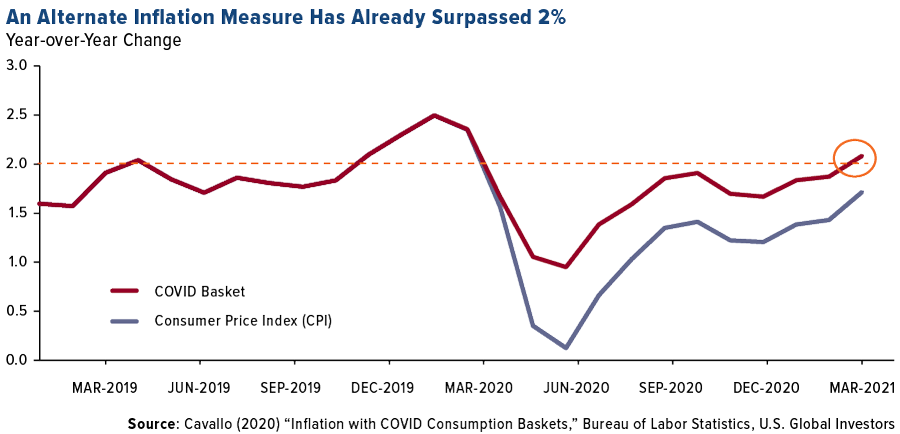
A Harvard economist, Alberto Cavallo, interestingly built his own index of goods and services that Americans actually bought during the pandemic, based on credit card transaction data. What this index shows is that inflation has been running slightly hotter than the CPI. In February, it actually surpassed the Federal Reserve’s target inflation rate of 2%.
Time to Get Exposure to Real Assets?
With prices climbing faster than what’s being reported, investors would be wise, I think, to get exposure to assets that are seeing some of the highest inflation right now and that are in a position to rise even more as the economy expands. That means real assets—metals and minerals, lumber, cement, energy and other commodities and raw materials. As I wrote in February, we may be on the verge of a new commodities supercycle, and it’s not too late to start participating.
That’s especially the case now that President Joe Biden has signaled his next legislative project will be infrastructure. Next week we’re supposed to get further details on his proposed $3 trillion spending package, but from what I’ve seen, $1 trillion of that will be devoted to improving roads, bridges, rail lines, ports, electric grids and more.
There’s much work to be done, after all. The American Society of Civil Engineers (ASCE) recently gave U.S. infrastructure a C- and estimated the investment gap to be as high as $2.6 trillion.
Treasury Secretary Janet Yellen told the House this week that taxes will likely need to be raised to pay for such a large-scale operation. All the more reason to rotate into commodities and the companies that produce them.
Gold Miners Recorded Record High Margins Last Year
That includes gold and gold miners. Last year, producers had their most profitable year ever, with average all-in sustaining cost (AISC) margins hitting a record $828 per ounce, according to Metals Focus. The AISC margin is defined as the gold price minus the cost to produce it. In other words, for every ounce of gold a mining company produced in 2020, it got to pocket $828 on average. This is comfortably higher than the previous record of $666 set in 2011.

The price of gold hit a record high of $2,075, which helped increase revenues. But companies have also been focused on cost discipline. We haven’t yet seen exploration budgets go on significantly.
The producer with the world’s lowest cost per ounce in 2020 was Polyus, according to Kitco News. The Russian miner’s AISC was only $604/oz. Among other companies in the top 10 were B2Gold ($788/oz), Centerra Gold ($799/oz), Kirkland Lake ($800/oz) and Polymetal ($874/oz).
Precious metal royalty and streaming companies also had a strong 2020. The world’s largest by market cap, Franco-Nevada, reported phenomenal results: record revenue of $1 billion, record net income of $326 million and record cash flow of $840 million. In addition, the company declared a quarterly dividend of $0.30 per share, a 15% increase from the prior dividend of $0.26.
Wheaton Precious Metals also reported strong 2020 results, with net income up triple digits compared to 2019. Annual revenue of $1 billion and annual operating cash flow of $765 million were both records for the company.
Email us at info@usfunds.com to receive even more information on gold royalty companies!

Gold Market
This week spot gold closed the week at $1,732.52, down $12.71 per ounce, or 0.73%. Gold stocks, as measured by the NYSE Arca Gold Miners Index, ended the week lower by 3.27%. The S&P/TSX Venture Index came in off 5.44%. The U.S. Trade-Weighted Dollar rose 0.88%.
| Date | Event | Survey | Actual | Prior |
|---|---|---|---|---|
| Mar-23 | New Home Sales | 870k | 775k | 948k |
| Mar-24 | Durable Goods Orders | 0.5% | -1.1% | 3.5% |
| Mar-24 | Hong Kong Exports YoY | 28.4% | 30.4% | 44.0% |
| Mar-25 | Initial Jobless Claims | 730k | 684k | 781k |
| Mar-25 | GDP Annualized QoQ | 4.1% | 4.3% | 4.1% |
| Mar-30 | Germany CPI YoY | 1.7% | — | 1.3% |
| Mar-30 | Conf Board Consumer Confidence | 96.0 | — | 91.3 |
| Mar-31 | Eurozone CPI Core YoY | 1.1% | — | 1.1% |
| Mar-31 | ADP Employment Change | 525k | — | 117k |
| Mar-31 | Caixin China PMI Mfg | 51.3 | — | 50.9 |
| Apr-01 | Initial Jobless Claims | 678k | — | 684k |
| Apr-01 | ISM Manufacturing | 61.0 | — | 60.8 |
| Apr-02 | Change in Nonfarm Payrolls | 628k | — | 379k |
Strengths
- The best performing precious metal for the week was palladium, up 1.47% with supplies expected to remain tight with Norilsk Nickel reduced production. There is a precious metal outperforming Bitcoin so far this year – have you heard of it? Iridium, which is a byproduct of producing platinum and palladium, is up 131% since the start of January, outpacing Bitcoin’s 85% gain. Demand for the metal, one of the rarest precious metals, has surged over the past 12 months for use in electronic screens. Iridium, which is also used in spark plugs, has climbed to $6,000 an ounce, according to Johnson Matthey Plc data.
- GV Gold PJSC, a Russian gold miner that BlackRock owns 18% of, set a price range for its IPO in Moscow that values the company at as much as $1.5 billion, reports Bloomberg. Trading is expected to begin on March 30. GV Gold, also known as Vysochaishy, said on March 15 that a group of shareholders including BlackRock planned to sell shares. They offered a combined stake of about 37%, which would mean a sale of as much as $555 million.
- Gold steadied on Wednesday after two days of declines after Fed Chair Jerome Powell played down concerns of out-of-control inflation. “From a technical perspective, the medium term remains negative but the pressure from sellers is slowing down,” wrote Carlo Alberto De Casa, chief analyst at ActivTrades. Spot gold rose 0.2% to $1,731.28 an ounce by 12:06 p.m. in London, after falling 1% over the prior two days.
Weaknesses
- The worst performing precious metal for the week was silver, down 4.52% on little news. Gold continues to lose investors. Total gold held by ETFs has fallen 6% this year to 100.3 million ounces after 67,509 ounces of outflows on Thursday. According to Bloomberg data, ETFs also cut silver from their holdings for the fourth straight day.
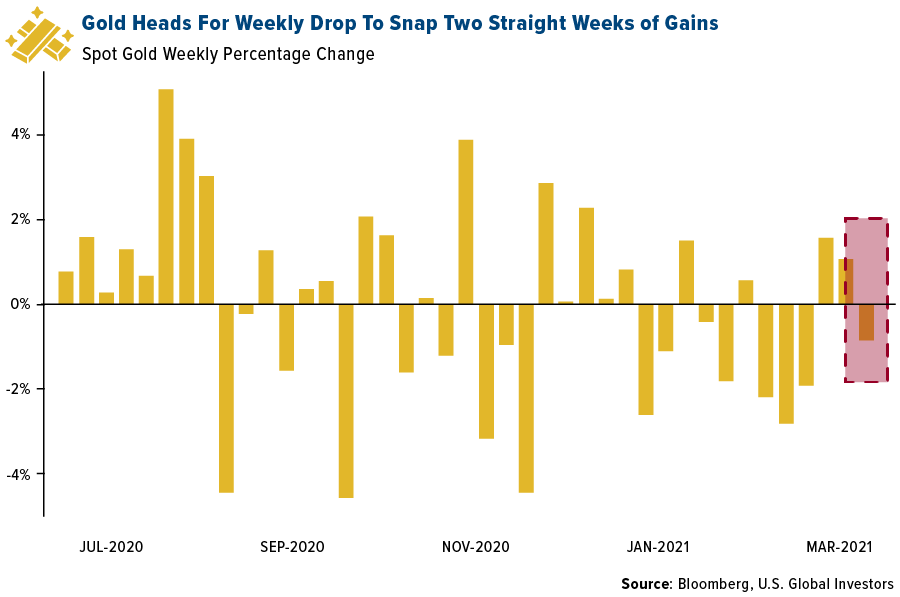
- Gold prices are down 9% so far this year and saw a weekly loss after two weeks prior of gains. The yellow metal still fell for the week even as bond yields halted their advance, under pressure from a dollar strengthening on the success of the U.S. vaccine program.
- Metalla Royalty & Streaming announced two separate royalty acquisitions this week. Metalla completed the acquisition of an existing 0.5% NSA royalty on a portion of Barrick Gold’s Alturas-Del Carmen project and an existing 0.45% NSR royalty on Agnico Eagle Mines’ and Kirkland Lake Gold’s North AK property in Kirkland Lake, Ontario. Wheaton Precious Metals announced it will purchase 100% of the payable gold production at the Santo Domingo project owned by Capstone Mining Corp. until 285,000 ounces have been delivered.
Opportunities
- Platinum-group metals mining executives and investors gathered for a virtual conference to discuss the industry’s future this week, reports Bloomberg. Anglo American Platinum CEO Natascha Viljoen said rhodium demand will remain strong in the short-term due to the metal’s ability to cut emissions from vehicles. Impala Platinum Holdings CEO Nico Muller said many of South Africa’s underground mines may be closed over the next decade, which would strain supply and further boost prices.
- Sibanye Stillwater’s CEO Neal Froneman said in an interview this week that “the gold industry needs to be consolidated, so you can either lead the consolidation or you will be consolidated.” Froneman says he wants to refocus Sibanye back toward gold and that other South African miners AngloGold Ashanti and Gold Fields would both fit with the company’s acquisition strategy. Sibanye hopes gold to get back to 40% to 50% of its earnings to ensure sustainable dividends.
- Metalla Royalty & Streaming announced two separate royalty acquisitions this week. Metalla completed the acquisition of an existing 0.5% NSA royalty on a portion of Barrick Gold’s Alturas-Del Carmen project and an existing 0.45% NSR royalty on Agnico Eagle Mines’ and Kirkland Lake Gold’s North AK property in Kirkland Lake, Ontario. Wheaton Precious Metals announced it will purchase 100% of the payable gold production at the Santo Domingo project owned by Capstone Mining Corp. until 285,000 ounces have been delivered.
Threats
- Peru’s front-runner for the presidency said they are ready to take a tougher stance against mining companies to ensure more of the revenue generated from its mineral wealth stays in the country, reports Bloomberg. “Unfortunately, they are not leaving us the resources that they should,” Yonhy Lescano said of the mining sector, “and that has been hurting us.” This is a major threat to miners operating in Peru.
- Jaguar Mining, a Canadian gold producer and explorer in Brazil, said it expects production to be disrupted due to a surge in COVID cases limiting contractors. The company said in a statement that “the current increase in the intensity of our Covid-19 measures, as dictated by government guidelines and the pandemic, may also limit production in the near term.” Bloomberg notes that Brazil has seen the highest level of COVID cases in the first quarter of 2021. This is a reminder that the global pandemic is not over and there is still potential for disruptions.
- The London Metal Exchange (LME) is facing backlash after issuing a consultation document to participants recommending permanently closing its open-outcry, reports Kitco News. Traders have been using hand signals and face-to-face “ring” trading for 144 years, but due to the pandemic the exchange was temporarily closed with all trading done over the phone or online. Most major exchanges have moved toward this direction of online trading through a platform for some time and many are asking how long the traders at the LME can hold out.

Index Summary
- The major market indices finished mixed this week. The Dow Jones Industrial Average gained 1.36%. The S&P 500 Stock Index rose 1.57%, while the Nasdaq Composite fell 0.58%. The Russell 2000 small capitalization index lost 2.89% this week.
- The Hang Seng Composite lost 2.26% this week; while Taiwan was up 1.47% and the KOSPI rose 0.05%.
- The 10-year Treasury bond yield lost 5 basis points to 1.673%.
Blockchain and Digital Currencies
Strengths
- Of the cryptocurrencies tracked by CoinMarketCap, the best performer for the week was Dent, rising 157.48%.
- Tesla Inc. announced that it will start accepting Bitcoin as payment for its electric cars and that it will only use internal and open-source software and any Bitcoin paid to the company will be retained as Bitcoin and not converted into a fiat currency. Currently only U.S. customers can pay for a Tesla vehicle using Bitcoin, with functionality being extended to non-U.S. customers later this year.
- At the Bank of International Settlements seminar, the director of the Digital Currency Research Institute at the People’s Bank of China (PBoC) said that the digital yuan, which is currently being trialed in the country, is necessary to provide backup to Alipay and WeChat Pay, which account for 98% of the mobile payments market in the country. Mu Changchun, the director, stated that if the systems of Alipay or WeChat Pay were to face any issues, either financial or technical, it could have a negative impact on the stability of China’s financial system. The PBoC has also proposed a set of global rules for monitoring central bank digital currencies (CBDCs).
Weaknesses
- Of the cryptocurrencies tracked by CoinMarketCap, the worst performing for the week was Avalanche, down 22.14%.
- Bitcoin’s worst selloff since December has dropped Grayscale Bitcoin Trust’s (GBTC) discount to a record 20%. This week alone, the trust has dropped 20% while Bitcoin dropped just over 10%. This record discount and GBTC’s free-fall highlights the extent to which the latest leg of retail-driven crypto enthusiasm is cooling. GBTC has traded at a premium to its net asset value since launching but has dropped into the discount range since last week of February 2021.
- The chart below showcases the heavy short positions taken by hedge funds on Bitcoin futures, signaling that they believe the current surge in the world’s biggest cryptocurrency will end even as it set a record high less than two weeks ago. As Bitcoin passed $60,000 this month, the chart shows that hedge funds closed out their long positions and increased their short positions.
Opportunities
- Fidelity Investments filed to offer a Bitcoin exchange-traded fund (ETF) in the U.S. market. The filing with the U.S. Securities and Exchange Commission (SEC) seeks approval for the “Wise Origin Bitcoin Trust”, which will track Fidelity’s bitcoin index. This filing marks the sixth Bitcoin ETF filing in the U.S. in the past three months, and market participants believe that this reflects a growing consensus among issuers that SEC approval is possible this year after a slew of denials from 2015 through early 2020.
- Cboe Global Markets’ CEO Ed Tilly said that it is looking to broaden its return to cryptocurrency by introducing more products and possibly re-listing Bitcoin futures. Cboe initially started listing Bitcoin futures in 2017 but that practice ended in 2019. The exchange also filed to list shares of VanEck’s Bitcoin ETF. Cboe’s rival, the Chicago Mercantile Exchange (CME), went live with its futures contract for ether in February. Tilly believes that the there is heavy demand from retail and institutional investors and that the exchange needs to be at the forefront of such opportunities.
- Chainalysis, a blockchain tracking firm whose clients are government investigators, crypto exchanges, and financial institutions, finalized its Series D capital raise. It raised $100 million from multiple backers, giving it a valuation of $2 billion. Chainalysis is one of the largest U.S. cryptocurrency investigation firms, helping government agencies to bust Bitcoin-linked crime rings and exchanges to vet and sometimes freeze stolen crypto assets. U.S. agencies alone have spent over $10 million on Chainalysis in 2020. Currently, the company’s customer list spans 30 countries and it said that a significant amount of the capital raised is going towards acquiring and onboarding new clients.
Threats
- Ray Dalio, the founder and CEO of the world’s largest hedge fund Bridgewater Associates, is warning that Bitcoin could be “outlawed” in the U.S. despite experts claiming that its decentralized network makes a ban virtually impossible to implement. He referred to the Gold Reserves Act of 1934 which banned Americans from holding gold or using it as money and said that every country treasures its monopoly on controlling supply and demand of money and currencies. Dalio’s comments come amidst proposals introduced in India that would ban people from buying, holding, trading, or mining cryptocurrencies.
- SEC’s commissioner Hester Peirce, also known as “Crypto Mom”, issued a warning to the issuers of fractionalized non-fungible tokens (NFT) and NFT index baskets as they could inadvertently be distributing investment products, which will be considered a security. She raised the concerns as more investors are entering the NFT marketplace and fractionalized interests in these assets enables smaller investors to gain exposure to a small share of a high-priced NFT.
- UBS Global Wealth Management said that Bitcoin’s limited real-world use and extreme volatility illustrates that cryptocurrencies recent surge is still a speculative bubble. The UBS team argues that Bitcoin’s limited and highly inelastic supply exacerbates its volatility and makes it a risky investment. They also emphasized that investors should act with extreme caution regarding crypto speculation and that clients should look into semiconductor shares to take advantage of crypto mining.

Domestic Economy and Equities
Strengths
- U.S. consumer sentiment surged in March by the most in nearly eight years as government pandemic relief payments began padding bank accounts and better-than-anticipated progress on vaccinations against COVID-19 bolstered outlooks. The University of Michigan’s Consumer Sentiment Index rose to a final reading of 84.9 this month from a preliminary level of 83 at mid-month and from February’s 76.8.
- The number of new applications for unemployment benefits fell below 700,000 in late March for the first time since the onset of the pandemic. Initial jobless claims filed traditionally through the states declined by 97,000 to 684,000 in the week ended March 20.
- Kansas City Southern was the best performing S&P 500 stock for the week, increasing 22.06%. Canadian Pacific Railway agreed to acquire Kansas City Southern in a stock and cash transaction representing an enterprise value of approximately $29 billion.
Weaknesses
- Orders for long-lasting manufactured goods fell in February as U.S. factories faced supply chain challenges. New orders for durable goods—products designed to last at least three years, such as computers and machinery—decreased 1.1% to a seasonally adjusted $254 billion in February compared with January, as reported by the Commerce Department.
- Consumer spending, which accounts for more than two-thirds of U.S. economic activity, dropped 1.0% in February after rebounding 3.4% in January. Personal income tumbled 7.1% after surging 10.1% in January. Unseasonably harsh weather in the second half of February, including severe winter storms in Texas and other parts of the densely populated South region, depressed homebuilding, production at factories, orders and shipments of manufactured goods.
- ViacomCBS Inc was the worst performing S&P 500 stock for the week, decreasing 50.46%. Shares of both ViacomCBS and Discovery plunged on Friday, extending their recent weakness after both stocks received another series of analyst downgrades.
Opportunities
- Baird’s Jonathan Komp upgraded Nike’s stock to outperform from neutral, writing that the weak year-to-date stock performance provides an opportunity for him to move from the sidelines for the first time in more than two years. He attributes part of the weakness to supply chain issues and China concerns, both of which he views as temporary.
- Booking Holdings was upgraded to buy from neutral at BofA, which wrote that the online travel agency was poised to see a rebound in demand. The company is “a top beneficiary of vast vaccine supply increase in Europe.” Analyst Justin Post sees signs of an improving travel environment over the coming six-to-12 months and wrote that Booking was among the best-positioned names for reopening.
- Wolfe Research upgraded IHeartMedia to outperform and raised its price target to a Street-high $24 from $15. The media entertainment company is “well positioned to reap the benefits of the cyclical recovery in core and the inflection in digital” growth, analyst John Janedis wrote.
Threats
- GameStop, the video game retailer that is most associated with the recent retail-trading frenzy, tumbled as much as 15% after its mixed fourth-quarter report.
- DaVita Inc. was downgraded to underperform from neutral at BofA Global Research as the analyst says dialysis is unlikely to see an uptick in usage as the economy rebounds.
- Wendy’s was downgraded to hold from buy at Argus Research Co., which cited concerns over valuation and traffic trends. The firm expects customer traffic “to remain relatively weak in the near term due to the pandemic” and is concerned about high debt/cap ratio.
Energy and Natural Resources Market
Strengths
- The best performing commodity for the week was lumber, up 7.49%. Lumber is up almost 200% since the pandemic began after factories shut down last year and demand for new houses outpaced supply.
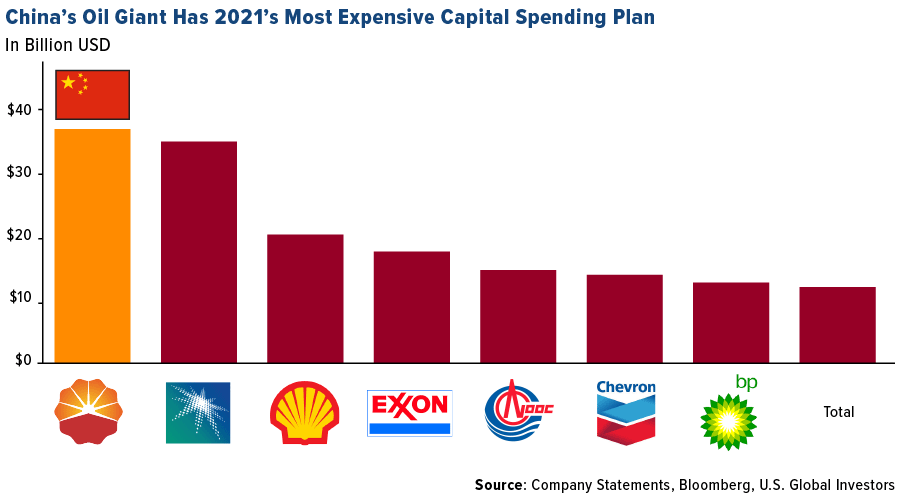
- PetroChina Co., China’s largest oil and gas producer and distributor, is planning on spending $37 billion in capital expenditure in 2021, more than its peers such as the Saudi Arabian Oil Co. and Exxon Mobil Corp. China’s quick recovery from the pandemic meant that its demand for oil and gas has fully recovered to pre-pandemic levels. This expenditure comes on the back of President Xi Jinping continuing to make energy security a top priority, and the government calling for increased domestic production of oil, gas, and coal over the next five years.
- Copper surged back above $9,000 a ton in London after Eurozone manufacturing hit a record in March, increasing confidence in the region’s economic recovery even as member nations fight against a resurgence in coronavirus infections. The Markit Eurozone Manufacturing PMI surged to 62.4, a record level going back to 1997. The expectations of a surge in industrial activity have increased bullish outlooks for copper.
Weaknesses
- The worst performing commodity for the week was cotton, down 5.08%. Cotton extended its worst skid in more than a year on signs of slowing demand for supplies from the world’s top suppling nation. U.S. export sales of cotton for the week ending March 18 slumped as demand from key buyer China slowed down.
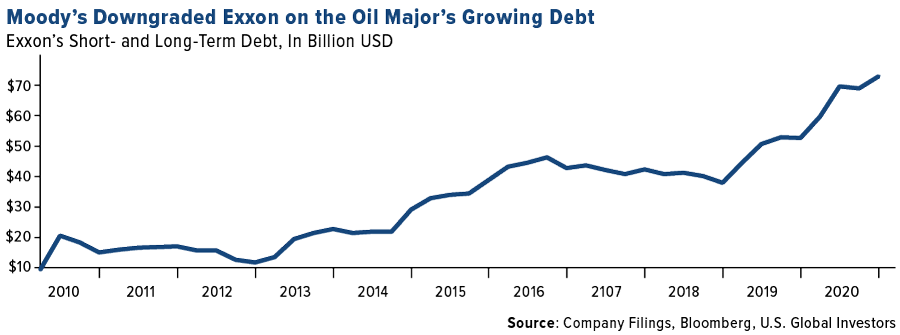
- Exxon Mobil Corp. was dealt a reputational blow this week as its debt was downgraded by Moody’s Investors Service after the pandemic slashed oil demand and a borrowing spree has deteriorated its financial leverage. Exxon’s debt is now rated as Aa2, down from Aa1, and is the second downgrade from the service in less than a year, after Moody’s stripped the company of its highest rating in April 2020. The oil giant’s total debt surged 40% in 2020 to $73 billion while plunging oil prices and fuel consumption reduced cash flow and the company tried to maintain its dividend payout. There are additional policy risks facing Exxon as the U.S. and Europe seem increasingly likely to change taxes and regulations to contain greenhouse gas emissions.
- Saudi Aramco’s payments to the Saudi Arabian government fell by 30% in 2020 as the coronavirus pandemic sent crude prices tumbling. The oil giant, which is 98% state-owned, kept its pledge of the $75 billion dividend but royalties and taxes more than halved to around $41 billion in 2020. Aramco’s debt ballooned to $162 billion at the end of 2020 after the company took on $90 billion of loans and bonds, sending its net debt-to-equity to 55% from 26% at the end of 2019. The company’s woes were heightened during the pandemic year as its upstream business of hydrocarbon production posted a 40% decline in earnings before interest and taxes while its downstream division of refining, chemicals, and retail fuel sales posted a loss of $5.4 billion.
Opportunities
- Trafigura Trading, the world’s biggest copper trader, expects the price of the metal to hit $15,000 a ton in the coming decade as it anticipates demand from global decarbonization to produce a deep market deficit. Trafigura is expecting global investment in renewable energy and electric-vehicle infrastructure to surge over the next decade and copper is set to play a pivotal part in this transition. Additional copper-bulls include Goldman Sachs, Bank of America, and Citigroup, who all expect copper to surpass $10,000 a ton in the next year.
- Berkshire Hathaway Inc. is proposing a $8.3 billion plan to build a lot of new natural gas plants to help Texas avoid a repeat of the winter storm blackouts. The conglomerate is seeking approval from lawmakers for creating a new company that would add 10 gigawatts of gas plants and emergency gas storage. The plants will be controlled by the Texas grid operator and Texas power customers would pay a fee to cover the costs of the plants. In exchange for making the investment, Berkshire is proposing to earn a 9.3% rate of return. The proposed company would be named the Texas Emergency Power Reserve and could have its plan operational by the winter of 2023 and is estimated to cost less than winterizing the state’s power generators.
- Andrew Forrest, the founder and CEO of Fortescue Metals Group Ltd., has made hydrogen, produced from renewable energy, the centerpiece of a plan to turn the company into a major clean-energy producer. Although the market believes that the future of mobility is in electric-vehicles, Forrest remains optimistic and points to China’s ambition to have over a million-hydrogen fuel-cell vehicles on the road by 2030 and plans in Japan and South Korea to increase their use.
Threats
- Yonhy Lescano, the front-runner in Peru’s presidential race, said that he is ready to take a tougher stance against mining companies operating in the nation to ensure that more of the revenue generated by the country’s vast mineral wealth stays within the country. He reportedly wants to close tax loopholes and negotiate profit-sharing agreements with multinational companies that operate within Peru’s borders. In an interview, Lescano said that he will propose a 50-50 profit sharing agreement between mining companies and the state but mentioned that he will not impose such a measure unilaterally.
- An estimated 200,000 seafarers are stuck on their vessels beyond the expiration of their contracts and past the globally accepted safety standards caused by a standoff between commodities firms and shipping companies. With the pandemic still looming around the world, some commodities firms are avoiding hiring certain vessels and are imposing conditions that may block relief for exhausted seafarers to keep deliveries of food, fuel, and other raw materials on schedule. Commodities firms are trying to steer clear of crew changes, which have become far more expensive and time-consuming amidst the pandemic, and this risk worsening the labor crisis which began 12 months ago as hundreds of thousands of mariners are long overdue for shore leave and some have been working without pay or a firm plan for repatriation.
- Ovintiv Inc., a shale oil producer, has agreed to sell drilling rights in South Texas to Validus Energy for $880 million, a price tag less than one-third of the $3.1 billion that Ovintiv paid in 2014 to acquire it. The sale was made after an activist investor pressed the shale driller to cut its debt load, arguing that the company was falling behind its peers because of misguided spending, expensive acquisitions, and inadequate environmental stewardship. Declining oil prices and increased operating costs for shale drillers has led to companies struggling to generate sustainable free cash flow and returns for their shareholders. This deal is just another example of challenges being faced by the industry.

Airline Sector
Strengths
- The best performing airline stock for the week was Norwegian Air Shuttle, down 0.3%. Norse Atlantic Airways, founded by executives with ties to Norwegian Shuttle, began a $150 million share placement to bankroll the launch of trans-Atlantic flights. Bloomberg reports the airline is aiming to fill a gap in the market created when Norwegian filed for insolvency. Proceeds from the share sale will provide capital and fund lease deposits on as many as 12 aircraft previously used by Norwegian.
- Shares of United Airlines rose 1.8% in premarket trading on Thursday after announcing plans to resume more than 20 domestic flights and fly to Latin America more than 100% of its pre-pandemic schedule, reports MarketWatch. The carrier is adding new nonstop routes between Midwest cities and plans to operate in May 52% of the overall schedule it operated in May 2019.
- Frontier, a leisure-focused airline, plans to raise $315 million in an IPO. The ticker will be “ULCC”. The recent IPO of Sun Country Airlines spiked 47% in its first day of trading. This will be the second airline public offering of 2021 and is a major sign of optimism in the return of air travel.
Weaknesses
- The worst performing airline stock for the week was TUI AG, down 13.7% on news that it scaled back its summer schedule. TUI is the world’s biggest tour operator and said the peak season won’t begin until July, two months later than normal. Air France-KLM CEO Ben Smith said in a briefing by the Airlines for Europe lobby that travel needs to restart in earnest by July 1 or carriers will risk missing out on the months that provide the bulk of earnings.
- The Bloomberg World Airlines Index tumbled after reaching a post-pandemic high last month. Renewed travel restrictions and vaccination delays are worrying investors that another summer could be “lost” due to COVID. France, Germany and Italy all announced new travel restrictions. U.K. Prime Minister Boris Johnson will provide an update on travel from Britain on April 5, where it is expected he will push the target date of May 17 back further.
- Airports Council International forecasts global passenger traffic will remain almost 50% below usual levels this year. The International Air Transport Association said carriers would need as much as $80 billion more in government money this year to survive the travel slump.
Opportunities
- Ryanair is preparing for a potential return to normal for European air travel this summer – even as other remains pessimistic. The carrier will start the summer at 50% of pre-pandemic capacity and end the summer at 80% of pre-pandemic capacity. Change fees have been eliminated to make it easier for customers to buy tickets.
- Singapore, Australia and New Zealand are attempting to form a “travel bubble”. All three countries are relatively free from COVID, and this may return 20-25% of traffic to the airlines that service these countries. Many countries are working on “COVID passports” to speed up the travel recovery by allowing those to fly who have been fully vaccinated.
- Boeing will resume delivery of its 787 Dreamliners after a five-month delay while mechanics investigated structural flaws in the aircraft. Bloomberg reports the plane maker hopes to delivery two or three of the jets in March. The U.S. Federal Aviation Administration (FAA) cleared two of the four planes which it had conducted special inspections.
Threats
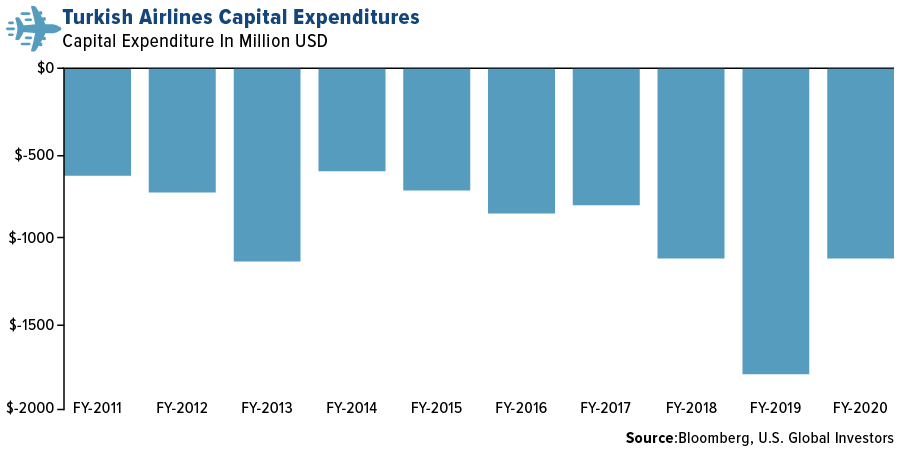
- Turkish Airlines plans to spend $1.5 billion on new equipment in 2021 even as demand remains weak and increased debt may be needed to finance the expansion. This level is high relative the carrier’s recent history, a time when global economies were strong and improving.
- As airlines struggle to remain afloat, orders for new aircraft are down. China Aircraft Leasing announced this week it had reduced an order for Boeing’s 737 MAX model to 66 plans from 92 and will delay the delivery of other aircraft. Airbus lost 92 plane orders in February, largely due to Norwegian Air’s insolvency. According to IBA, around 1,500 plans were retired early by reasonably healthy airlines. Globally, 30% of airline fleets remain parked in storage, with a high of 53% among European carriers. Nearly 30% of Chinese capacity is parked while 27% of U.S. capacity is parked.
- International air travel remains weak. Capacity is down 75% from pre-pandemic levels. International travel in the U.S. is down 60% from pre-pandemic levels and capacity to and from China is down 95% since April 2020. However, a new post-pandemic high of passengers screened by TSA in the U.S. was reached on March 21 with 1.5 million travelers.
Emerging Markets
Strengths
- The best performing country in emerging Europe for the week was the Czech Republic, gaining 1.3%. The best performing country in Asia this week was the Philippines, gaining 1.9%.
- The Hungarian forint was the best performing currency in emerging Europe this week, gaining 50 basis points. The Pakistani rupee was the best performing currency in Asia this week, gaining 60 basis points.
- Eurozone, the United States and China’s money supply totaled $71 trillion in February, up 15% on average year-over-year, or $13 trillion. This huge increase in money supply around the world supports nominal growth and asset prices.
Weaknesses
- The worst performing country in emerging Europe for the week was Turkey, losing 9.4%. The worst performing country in Asia this week was Hong Kong, losing 2.8%.
- The Turkish lira was the worst performing currency in emerging Europe this week, losing 10%. The Thailand baht was the worst performing currency in Asia, losing 1%.
- Europe worries about the spread of the third wave of the coronavirus and some countries have decided to increase their restrictions during the week of Easter. Poland, the Czech Republic and Hungary have the highest number of COVID-19 cases.
Opportunities
- Eurozone economic activity returned to growth in March as factories increased their production to its fastest pace in 23 years. IHS Markit’s Composite PMI bounced above the 50 mark that separates growth from contraction, mostly supported by strong improvement in manufacturing activity. Bloomberg economists predict the final March manufacturing reading to remain at 62.4 versus the prior reading of 57.9. Data will be released on April 1.
- Bloomberg reports that Russian gas exports via pipeline to Europe may benefit from the Suez Canal blockage as LNG exports from the Middle East are affected by the blockage. Data shows three loaded cargoes in the Suez Gulf are waiting to cross the Mediterranean that were first expected to arrive in Europe in early April. Russian gas supplies to Europe are currently below maximum capacity.
- The Philippines lowered the corporate tax rate from 30% to 25% for most businesses, and as low as 20% for small enterprises. The law will bring the Philippines closer to the average rate in Southeast Asia at around 22%, the government’s Department of Finance said.
Threats
- Once again, Turkish equites and the lira declined sharply after President Erdogan unexpectedly fired the central bank’s governor. The governor was credited for strengthening the troubled Turkish lira since he took office back in November 2020. Bloomberg economists now predict a rate cut soon, a move that will further weaken the country’s currency. Charlie Robertson from Renaissance Capital sees the lira weakening by more than 10% by year end.
- Honk Kong and Macao suspended the use of the BioNTech coronavirus vaccine Wednesday, citing packaging defects. This move further complicates the vaccine distribution process in Hong Kong, as it was already hindered by mistrust and low interest in vaccination.
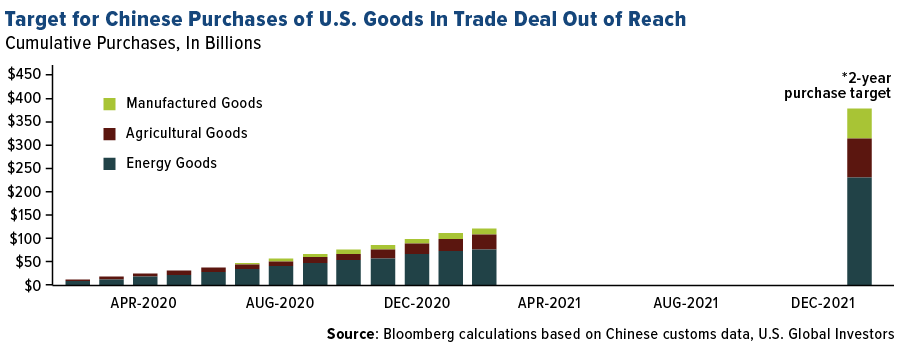
- China is behind its two-year targets to purchase United States goods as was set in a trade deal. Total purchases of U.S. agricultural, manufacturing, and energy goods were $123 billion in the 14 months since the trade deal was signed in January of 2020, according to Bloomberg analysis of the official Chinese data. That was only 32.6% of the target of $378 billion for 2020-2021.
Leaders and Laggards
| Index | Close | Weekly Change($) |
Weekly Change(%) |
|---|---|---|---|
| 10-Yr Treasury Bond | 1.67 | -0.05 | -2.90% |
| Oil Futures | 60.83 | -0.59 | -0.96% |
| Hang Seng Composite Index | 4,436.70 | -126.46 | -2.77% |
| S&P Basic Materials | 500.55 | +12.23 | +2.50% |
| Korean KOSPI Index | 3,041.01 | +1.48 | +0.05% |
| S&P Energy | 381.18 | +11.07 | +2.99% |
| Nasdaq | 13,138.73 | -76.51 | -0.58% |
| DJIA | 33,072.88 | +444.91 | +1.36% |
| Russell 2000 | 2,221.48 | -66.06 | -2.89% |
| S&P 500 | 3,974.54 | +61.44 | +1.57% |
| Gold Futures | 1,733.70 | -10.20 | -0.58% |
| XAU | 135.87 | -5.70 | -4.03% |
| S&P/TSX VENTURE COMP IDX | 943.29 | -52.51 | -5.27% |
| S&P/TSX Global Gold Index | 286.43 | -8.28 | -2.81% |
| Natural Gas Futures | 2.56 | +0.03 | +1.10% |
| Index | Close | Monthly Change($) |
Monthly Change(%) |
|---|---|---|---|
| Korean KOSPI Index | 3,041.01 | +46.03 | +1.54% |
| 10-Yr Treasury Bond | 1.67 | +0.30 | +21.50% |
| Gold Futures | 1,733.70 | -67.10 | -3.73% |
| S&P Basic Materials | 500.55 | +21.69 | +4.53% |
| S&P 500 | 3,974.54 | +49.11 | +1.25% |
| DJIA | 33,072.88 | +1,111.02 | +3.48% |
| Nasdaq | 13,138.73 | -459.24 | -3.38% |
| Oil Futures | 60.83 | -2.39 | -3.78% |
| Hang Seng Composite Index | 4,436.70 | -263.44 | -5.60% |
| S&P/TSX Global Gold Index | 286.43 | -0.90 | -0.31% |
| XAU | 135.87 | -7.48 | -5.22% |
| Russell 2000 | 2,221.48 | -62.90 | -2.75% |
| S&P Energy | 381.18 | +4.98 | +1.32% |
| S&P/TSX VENTURE COMP IDX | 943.29 | -117.14 | -11.05% |
| Natural Gas Futures | 2.56 | -0.29 | -10.20% |
| Index | Close | Quarterly Change($) |
Quarterly Change(%) |
|---|---|---|---|
| XAU | 135.87 | -7.86 | -5.47% |
| S&P/TSX Global Gold Index | 286.43 | -34.31 | -10.70% |
| Gold Futures | 1,733.70 | -156.60 | -8.28% |
| DJIA | 33,072.88 | +2,873.01 | +9.51% |
| S&P 500 | 3,974.54 | +271.48 | +7.33% |
| Nasdaq | 13,138.73 | +334.00 | +2.61% |
| Korean KOSPI Index | 3,041.01 | +234.15 | +8.34% |
| Natural Gas Futures | 2.56 | +0.04 | +1.79% |
| S&P Basic Materials | 500.55 | +50.10 | +11.12% |
| Russell 2000 | 2,221.48 | +217.53 | +10.86% |
| Oil Futures | 60.83 | +12.60 | +26.12% |
| Hang Seng Composite Index | 4,436.70 | +276.74 | +6.65% |
| S&P/TSX VENTURE COMP IDX | 943.29 | +97.51 | +11.53% |
| S&P Energy | 381.18 | +93.80 | +32.64% |
| 10-Yr Treasury Bond | 1.67 | +0.75 | +80.67% |
U.S. Global Investors, Inc. is an investment adviser registered with the Securities and Exchange Commission ("SEC"). This does not mean that we are sponsored, recommended, or approved by the SEC, or that our abilities or qualifications in any respect have been passed upon by the SEC or any officer of the SEC.
This commentary should not be considered a solicitation or offering of any investment product.
Certain materials in this commentary may contain dated information. The information provided was current at the time of publication.
Some links above may be directed to third-party websites. U.S. Global Investors does not endorse all information supplied by these websites and is not responsible for their content.
Holdings may change daily. Holdings are reported as of the most recent quarter-end. The following securities mentioned in the article were held by one or more accounts managed by U.S. Global Investors as of (12/31/2020):
MMC Norilsk Nickel PJSC
Anglo American PLC
Impala Platinum Holdings Ltd
Sibanye Stillwater Ltd
AngloGold Ashanti Ltd
Gold Fields Ltd
Metalla Royalty & Streaming Ltd
Wheaton Precious Metals Corp
Kirkland Lake Gold Ltd
Jaguar Mining Inc
United Airlines Holdings Inc
Turk Hava Yollari AO (Turkish Airlines)
Polyus PJSC
Polymetal International PLC
B2Gold Corp
Centerra Gold Inc
Kirkland Lake Gold Ltd
Franco-Nevada Corp
Wheaton Precious Metals Corp
Nike Inc
*The above-mentioned indices are not total returns. These returns reflect simple appreciation only and do not reflect dividend reinvestment. The Dow Jones Industrial Average is a price-weighted average of 30 blue chip stocks that are generally leaders in their industry. The S&P 500 Stock Index is a widely recognized capitalization-weighted index of 500 common stock prices in U.S. companies. The Nasdaq Composite Index is a capitalization-weighted index of all Nasdaq National Market and SmallCap stocks. The Russell 2000 Index® is a U.S. equity index measuring the performance of the 2,000 smallest companies in the Russell 3000®, a widely recognized small-cap index. The Hang Seng Composite Index is a market capitalization-weighted index that comprises the top 200 companies listed on Stock Exchange of Hong Kong, based on average market cap for the 12 months. The Taiwan Stock Exchange Index is a capitalization-weighted index of all listed common shares traded on the Taiwan Stock Exchange. The Korea Stock Price Index is a capitalization-weighted index of all common shares and preferred shares on the Korean Stock Exchanges. The Philadelphia Stock Exchange Gold and Silver Index (XAU) is a capitalization-weighted index that includes the leading companies involved in the mining of gold and silver. The U.S. Trade Weighted Dollar Index provides a general indication of the international value of the U.S. dollar. The S&P/TSX Canadian Gold Capped Sector Index is a modified capitalization-weighted index, whose equity weights are capped 25 percent and index constituents are derived from a subset stock pool of S&P/TSX Composite Index stocks. The S&P 500 Energy Index is a capitalization-weighted index that tracks the companies in the energy sector as a subset of the S&P 500. The S&P 500 Materials Index is a capitalization-weighted index that tracks the companies in the material sector as a subset of the S&P 500. The S&P 500 Financials Index is a capitalization-weighted index. The index was developed with a base level of 10 for the 1941-43 base period. The S&P 500 Industrials Index is a Materials Index is a capitalization-weighted index that tracks the companies in the industrial sector as a subset of the S&P 500. The S&P 500 Consumer Discretionary Index is a capitalization-weighted index that tracks the companies in the consumer discretionary sector as a subset of the S&P 500. The S&P 500 Information Technology Index is a capitalization-weighted index that tracks the companies in the information technology sector as a subset of the S&P 500. The S&P 500 Consumer Staples Index is a Materials Index is a capitalization-weighted index that tracks the companies in the consumer staples sector as a subset of the S&P 500. The S&P 500 Utilities Index is a capitalization-weighted index that tracks the companies in the utilities sector as a subset of the S&P 500. The S&P 500 Healthcare Index is a capitalization-weighted index that tracks the companies in the healthcare sector as a subset of the S&P 500. The S&P 500 Telecom Index is a Materials Index is a capitalization-weighted index that tracks the companies in the telecom sector as a subset of the S&P 500. The NYSE Arca Gold Miners Index is a modified market capitalization weighted index comprised of publicly traded companies involved primarily in the mining for gold and silver. The Consumer Price Index (CPI) is one of the most widely recognized price measures for tracking the price of a market basket of goods and services purchased by individuals. The weights of components are based on consumer spending patterns. The Purchasing Manager’s Index is an indicator of the economic health of the manufacturing sector. The PMI index is based on five major indicators: new orders, inventory levels, production, supplier deliveries and the employment environment. The S&P/TSX Venture Composite Index is a broad market indicator for the Canadian venture capital market. The index is market capitalization weighted and, at its inception, included 531 companies. A quarterly revision process is used to remove companies that comprise less than 0.05% of the weight of the index, and add companies whose weight, when included, will be greater than 0.05% of the index. Gross domestic product (GDP) is the monetary value of all the finished goods and services produced within a country’s borders in a specific time period, though GDP is usually calculated on an annual basis. It includes all of private and public consumption, government outlays, investments and exports less imports that occur within a defined territory.
M2 Money Supply is a broad measure of money supply that includes M1 in addition to all time-related deposits, savings deposits, and non-institutional money-market funds. The Bloomberg World Airlines Index is a capitalization-weighted index of the leading airlines stocks in the World.
