Positive First-Quarter Data Point to a Global, Sustained Economic Boom
This week, LPL Financial wrote that we were entering the "best business conditions of the 21st century." Jamie Dimon, meanwhile, said he believes the U.S. economy is entering a "Goldilocks moment."
By Frank Holmes
CEO and Chief Investment Officer
U.S. Global Investors

Millions of Americans, it seems, felt that the time was right to trade in their clunkers for a new set of wheels.
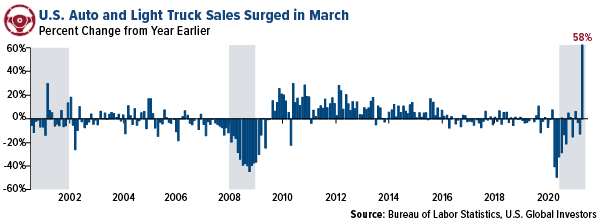
Sales of cars and light trucks surged an incredible 58% in March compared to last year, according to Bureau of Labor Statistics data. Some 1.6 million vehicles were driven off car lots during the month, representing over 18 million on a seasonally-adjusted annual rate (SAAR).
There could be several reasons why car sales skyrocketed last month, the most obvious being that pandemic restrictions are gradually being lifted. A fresh infusion of stimulus money also didn’t hurt.
But then there’s the matter of cost. Due to the global semiconductor chip shortage, which has temporarily halted production at some North American auto plants, the price of used vehicles is up an eye-watering 26% from last year, according to the Manheim Used Vehicle Value Index. Borrowing costs are also on the rise, prompting consumers to act fast.
Last month, I advised readers to buy a new car now if they were in the market for one, and it looks as if many Americans were of the same mind. I expect prices to climb even more before they start to plateau.
Luxury Carmakers Set New Sales Records
Looking globally, I was surprised to see just how well the luxury vehicle market performed in the first quarter. Daimler-owned Mercedes-Benz sold over 78,000 cars and trucks during the period, a 16% increase from last year. Toyota’s Lexus brand took the number two spot in terms of sales, moving 74,000 units for the quarter.
Tesla announced that it delivered a record 185,000 vehicles in the three-month period, well over double the amount in the first quarter of 2020. The electric vehicle (EV) manufacturer, which reported its first profitable year in 2020, is the heaviest weighted stock in the benchmark S&P Global Luxury Index.
Rolls-Royce Motor Cars also reported a new sales record in its 116-year history. The superluxury British carmaker, fully owned by Bayerische Motoren Werke (BMW), delivered 1,380 vehicles, up 62% from the same period in 2020 and exceeding the previous quarterly record set in 2019. Among its bestsellers were the Cullinan, a nearly three-ton SUV that starts at $335,000, and its new Ghost model, which has a similar price tag.
Best Business Conditions of the 21st Century
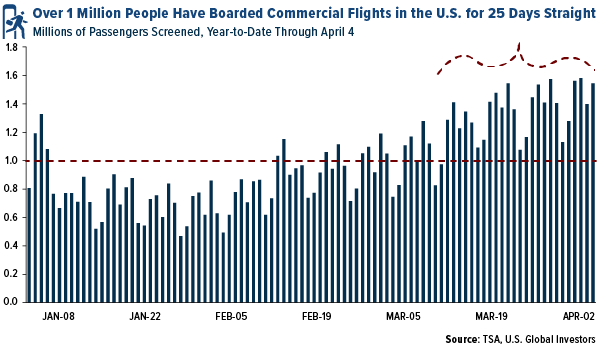
All of this is positive economic news that tells me we’re more than ready to put the pandemic in the rearview mirror. For the first time since this all started a year ago, more than one million people per day have been flying commercial in the U.S. for 30 straight days. Even more passengers are expected in the coming days and weeks as greater than one in five Americans are now fully vaccinated against COVID-19. Restaurants and diners across America are reportedly struggling to find workers fast enough to meet demand.
Indeed, in a report this week, LPL Financial wrote that we were entering the “best business conditions of the 21st century.” Both the ISM Manufacturing and Services PMIs hit their highest levels in decades on accelerating vaccine distribution and unprecedented fiscal stimulus.
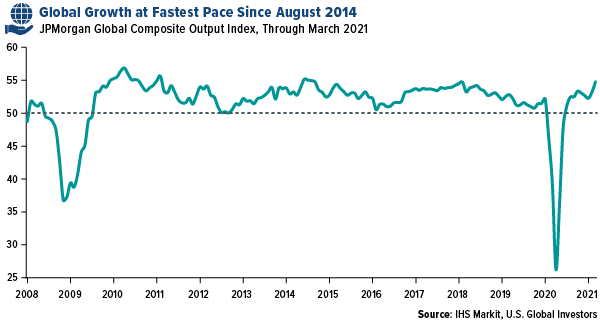
The JPMorgan Global Composite PMI, meanwhile, rose to a 79-month high of 54.8 in March, one of its best readings of the past decade. U.S. leads the expansion, with growth not only at its fastest pace since August 2014 but also running close to an all-time U.S. survey high. Looking just at manufacturing, of the 29 countries that are tracked, only three—Myanmar, Thailand and Malaysia—were below the 50.0 threshold.
This boom could run into 2023, Jamie Dimon said this week. In his annual letter to shareholders, the JPMorgan chief wrote that he sees the U.S. economy entering a “Goldilocks moment,” buttressed by “excess savings, new stimulus savings, huge deficit spending, more QE, a new potential infrastructure bill, a successful vaccine and euphoria around the end of the pandemic.” With the S&P 500 having returned an unbelievable 54% year-over-year at the end of March, markets “may very well be pricing in not only a booming economy but also the technical factor that lots of the excess liquidity will find its way into stocks,” Dimon said.
In other words, the bulls are solidly in charge for the foreseeable future. I expect to see another quarter of stock outperformance relative to bonds, though the debt selloff may not be as pronounced in this second quarter as it was in the first.
Gold Miner Debt Near Record Low
So where does that leave gold?
The yellow metal is off to its worst start in years, having fallen more than 10% during the first quarter as investors largely shunned safe haven investments in favor of risk assets.
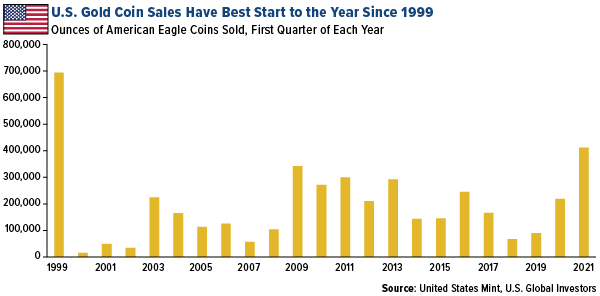
This has created an incredible buying opportunity that other savvy investors have jumped at. The U.S. Mint reported that sales of American Eagle gold coins climbed to 412,000 ounces in the first three months of 2021, its best quarter since 1999. Australia’s Perth Mint also had a remarkable quarter, with sales in February up 441% year-to-year.
At the end of last month, I shared with you that gold producers had their most profitable year ever in 2020, based on the average all-in sustaining cost (AISC) margin. For every ounce of the metal produced last year, miners pocketed a record $828 on average.
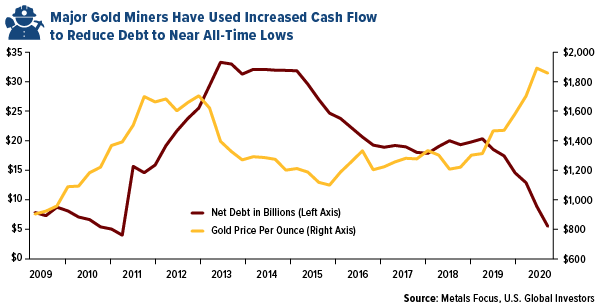
Now we know what they’ve been doing with their increased cash flow. According to a recent report by Metals Focus, gold miners have been paying down their debt, which currently stands at a collective $5.5 billion, the lowest level since 2011 and near all-time lows. Two miners in Metals Focus’s peer group are now net cash positive, the precious metals consultancy says.
Like physical gold, stock in the producers looks like a buy to me. All of the companies in the peer group are paying regular dividends, and with debt reduction near completion, we could be seeing some mergers and acquisitions (M&As) in the sector soon.
Read the latest on the gold mining industry, including royalty and streaming companies, by clicking here.
April 7, 2021Fully Vaccinated People Are Free to Fly Commercial Again |
April 5, 2021Visa and PayPal Give the Green Light to Cryptos. Should You? |
March 30, 2021Gold Miners Recorded Record High Margins in 2020 |
|||
Gold Market
Spot gold closed the holiday extended week at $1,743.88, up $14.57 per ounce, or 0.84%. Gold stocks, as measured by the NYSE Arca Gold Miners Index, ended the week higher by 3.61%. The S&P/TSX Venture Index came in off 0.15%. The U.S. Trade-Weighted Dollar rose/fell 0.81%.
| Date | Event | Survey | Actual | Prior |
|---|---|---|---|---|
| Apr-2 | Change in Nonfarm Payrolls | 660k | 916k | 468k |
| Apr-5 | Durable Goods Orders | -1.1% | -1.2% | -1.1% |
| Apr-8 | Initial Jobless Claims | 680k | 744k | 728k |
| Apr-9 | PPI Final Demand YoY | 3.8% | 4.2% | 2.8% |
| Apr-13 | ZEW Survey Expectations | 79.0 | — | 76.6 |
| Apr-13 | ZEW Survey Current Situation | -55.0 | — | -61.0 |
| Apr-13 | CPI YoY | 2.5% | — | 1.7% |
| Apr-15 | Germany CPI YoY | 1.7% | — | 1.7% |
| Apr-15 | Initial Jobless Claims | 700k | — | 744k |
| Apr-15 | China Retail Sales YoY | 28% | — | — |
| Apr-16 | Eurozone CPI Core YoY | 0.9% | — | 0.9% |
| Apr-16 | Housing Starts | 1606k | — | 1421k |
Strengths
- The best performing precious metal for the week was silver, up 1.18% as hedge funds boost net-long silver positions to a three-week high. Gold rose on Thursday as the dollar weakened after dovish rhetoric from the Federal Reserve, which gave no indication of imminent tightening of monetary policy, reports Bloomberg.
- India’s gold imports in March rose 471% from a year earlier to a record 160 tonnes, reports Reuters. Buyers are drawn by a reduction in import taxes for the metal and a correction in prices from record highs last year. The world’s second largest consuming gold country imported a record 321 tonnes in the first quarter, up from 124 tonnes a year ago.
- Hungary tripled its gold reserves in March in one of the biggest purchases by a central bank in decades. Bloomberg reports that Hungary’s monetary authority raised its bullion holdings to 94.5 tons. The nation’s purchase would be the biggest since June 2019, when Poland bought 94.9 tons, according to World Gold Council (WGC) data.
Weaknesses
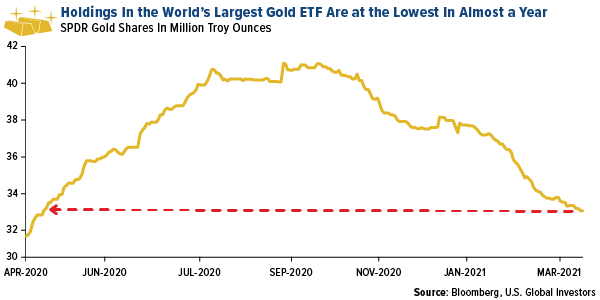
- The worst performing precious metal for the holiday extended week was palladium, down 0.97% on little news. Holdings in the SPDR Gold Shares, the largest ETF backed by gold, have fallen in four of the past five months. Bloomberg data shows holdings are at the lowest in nearly a year, around 33 million troy ounces. This is a sign that many investors are giving up on gold.
- Greenland Minerals announced a trading halt on the Australian Stock Exchange. Reuters reported that Greenland’s newly elected government will freeze the company’s rare earth mining project, which has over 1 billion tonnes of mineral resources.
- Indian firms that lend against gold and cutting tenors are asking for more collateral to protect against falling bullion prices, reports Bloomberg. Gold loans have surged in the last 12 months as small businesses seek help to rebuild after lockdowns and are using family jewelry as collateral. “People are sentimental about their jewelry,” said George Muthoot Alexander, managing director at Muthoot Finance. “They will never want to default despite a fall in gold prices as they intend to get back their pledged ornaments.” Muthoot Finance saw lending rise over 25% and the company holds 146 tons of gold, higher than the official reserves of Singapore and Sweden.
Opportunities
- Giovanni Staunovo, strategist at UBS Group, expects shortages in the platinum and palladium markets this year due to supply disruptions at top producer Nornickel’s mines in Russia. UBS cut its platinum mine supply estimate for 2021 by 140,000 ounces, which would lead to a deficit of around 185,000 ounces. This would be the third straight year of undersupply. The bank also cut its forecast for palladium mine supply by 545,000 ounces, translating into a deficit of around 1 million ounces and a 10th straight year of market shortfall.
- Demand for physical gold has grown even as ETF holdings decline. The Perth Mint reported gold coin and minted bar sales of 130,000 ounces in March, surpassing the record 124,104 ounces sold in February. American Eagle gold coin sales had the best start to the year since 1999, with nearly 400,000 ounces sold in the first quarter.
- Russian tycoon Andrey Komarov is in talks to purchase the Kumroch gold deposit in Russia’s Far East from Zoloto Kamchatki, reports Bloomberg. The deposit holds 34.4 tons of gold reserves and is set to begin production in 2025, with expected annual output of as much as 5 tons. He is also interested in investing in the Fedorova Tundra platinum and palladium project.
Threats
- Bitcoin and other cryptocurrencies continue to steal the spotlight away from gold. Robinhood said that 9.5 million users traded cryptos on its platform during the first quarter of 2021, compared with 1.7 million in the previous quarter, reports Kitco News. Bitcoin currently accounts for 10% of that anti-fiat market, notes Bloomberg. "As this share doubles or trebles, it arithmetically requires a doubling or trebling of cryptocurrency prices," says Dhaval Joshi, chief strategist for BCA Research’s Counterpoint product.
- Pure Gold warned that ramp up issues have affected initial ore grades being run through the mill leading to reduced gold output. In addition, Pure Gold expanded its credit line with Sprott Resource Lending for up to $20 million. The share price has fallen about 30% over the last four weeks.
- Strong economic growth as the world recovers from the pandemic remains a threat to precious metal prices. Gold and silver were lower on Friday morning after U.S. producer prices for March boosted the dollar and pushed up Treasury yields. The PPI data was up 1% versus expectations for a rise of just 0.4%, reports Kitco News.
Index Summary
- The major market indices finished mostly up this week. The Dow Jones Industrial Average gained 1.95%. The S&P 500 Stock Index rose 2.71%, while the Nasdaq Composite climbed 3.12%. The Russell 2000 small capitalization index lost 0.46% this week.
- The Hang Seng Composite lost 1.13% this week; while Taiwan was up 1.71% and the KOSPI rose 1.44%.
- The 10-year Treasury bond yield fell 2 basis points to 1.654%.
Blockchain and Digital Currencies
Strengths
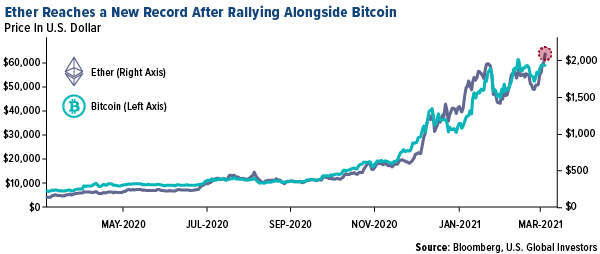
- Of the cryptocurrencies tracked by CoinMarketCap, the best performer for the week was Bitcoin Gold, rising 142.57%. Ether hit a new record high as it continues to rally alongside Bitcoin.
- The Bank of Japan (BOJ) kicked off the first phase of experimenting with a central bank digital currency (CBDC) this week. According to a survey conducted by the Bank for International Settlements, 86% of central banks are actively researching the potential for CBDCs, 60% are experimenting with the technology, and 14% are deploying pilot projects.
- Paxos, a U.S.-based stablecoin operator, is planning to apply for a formal clearing agency license with the Securities and Exchange Commission (SEC). This announcement comes right after Paxos used blockchain technology to achieve same-day settlement for a selection of U.S. equity trades, with the help of Credit Suisse and Instinet, the trading arm of Nomura Holdings Inc. Additionally, Paxos is also seeking approval to become a fully regulated crypto bank.
Weaknesses
- Of the cryptocurrencies tracked by CoinMarketCap, the worst performing for the week was Klaytn, down 21.42%.
- iCE3, a South African cryptocurrency exchange, has reportedly gone into liquidation after announcing last month that it had found discrepancies in its balances. The exchange told customers that withdrawals from the platform have been disabled based on the advice of its legal and auditing team.
- Bitcoin mining operations in China, the country that accounts for more than 75% of the blockchain’s operations globally as of April 2020, are projected to hit peak energy consumption in 2024 at around 297 terawatt-hours, generating 130 million metric tons of carbon emissions. China’s energy consumption from Bitcoin mining in 2024 will exceed total energy consumption of countries like Italy and Saudi Arabia, and the carbon emissions will exceed annual greenhouse emissions of countries including the Netherlands, Spain, and Czech Republic.
Opportunities
- State Street, the second-oldest bank in the U.S., announced that its Currenex trading technology arm is working with Pure Digital, a London-based infrastructure provider to foreign exchange trading world, to create an institution-focused digital currency trading platform. Pure Digital’s CEO, Lauren Kiley, confirmed that in addition to State Street, other banks have signed up to use the platform which is set to launch midway through 2021. The platform is an over-the-counter offering with bilateral credit lines and full transparency, so that the clients can see exactly who they are dealing with and can turn on and off counterparties as they see fit.
- BOJ said this week that there is an opportunity to lay out common rules around central bank digital currencies with the world’s seven major central banks. BOJ’s head of payments and settlement department stressed that a set of common rules will lay the groundwork for efficient cross-border payments and that CBDCs play differing roles for advanced nations with a robust banking system and emerging economies that can use digital currencies to make up for the shortfalls in their financial infrastructure.
- Fidelity Investments’ head of crypto division, Tom Jessop, said that he believes that the crypto-economy has opened a new chapter in traditional finance circles and things have reached a tipping point for the industry. He added that the maturation and adoption of digital assets as an investment class will continue in the coming years and one of the reasons for that is extremely low interest rates in traditional finance. Fidelity filed paperwork with the U.S. Securities and Exchange Commission (SEC) to list a new Bitcoin exchange traded fund (ETF) in March.
Threats
- Venture Capitalist Peter Thiel is urging the U.S. government to consider tighter regulations on cryptocurrencies. Thiel, who is pro-cryptocurrencies, said that he thinks Bitcoin should be thought of as a Chinese financial weapon against the U.S. and that it threatens fiat money, especially the U.S. dollar’s reserve currency status. Additionally, the CEO of JPMorgan, Jamie Dimon, listed the legal and regulatory status of cryptocurrencies as one of the serious emerging issues that need to be dealt with and added that digital assets are not his “cup of tea.”
- The Central Bank of Sri Lanka published a public notice this week flagging three types of crypto activities: cryptocurrency mining, investment in initial coin offerings and trading via cryptocurrency exchanges. The bank warned that these expose investors to significant risks and identified four main areas of concern for retail investors like the lack of any specific legal or regulatory recourse in case of disputes, a distrust of the high volatility of cryptocurrency value, the likelihood of cryptocurrencies being used for illicit activities and that buying cryptocurrencies from a foreign exchange is a direct violation of the country’s Foreign Exchange Act.
- Mati Greenspan, founder of Quantum Economics, warned that the U.S. Securities and Exchange Commission’s (SEC) latest action against decentralized content platform LBRY could threaten the future of all cryptocurrencies. The SEC filed a complaint on March 29 alleging that LBRY offered and sold millions worth of unregistered securities through LBRY Credit tokens since 2016. The company responded to those allegations by stating that its tokens are utility-focused and not for speculation.
Domestic Economy and Equities
Strengths
- A measure of U.S. services industry activity surged to a record high in March amid robust growth in new orders, in the latest indication of a roaring economy that is being boosted by increased vaccinations and massive fiscal stimulus. The ISM’s non-manufacturing activity index rebounded to a reading of 63.7 last month also due to warmer weather. That was the highest in the survey’s history and followed 55.3 in February.
- Unemployment rates in each of the largest U.S. metropolitan areas dipped below 10% in February for the first time since the pandemic started as the economic recovery gathered momentum, government data released this week showed.
- Twitter was the best performing S&P 500 stock for the week, increasing 11.53%. Shares rallied on speculation the company has been in discussions for a potential takeover of the video chat app Clubhouse.
Weaknesses
- The number of Americans filing for first-time unemployment insurance unexpectedly rose in the latest week, showing that layoffs continue even as rehiring is robust and job openings plentiful. In the week ending April 3, seasonally adjusted initial claims increased by 16,000 to 744,000.
- Orders for U.S. manufactured goods fell 0.8% in February, the Commerce Department said Monday. This was the first decline since the depth of the coronavirus recession last April.
- Pioneer Natural Resources was the worst performing S&P 500 stock for the week, decreasing 10.58%. The company’s shares fell after JPMorgan downgraded them to Neutral from Overweight as investors digest the shift of the company to buyer from a deal target.
Opportunities
- U.S. airline stocks still have room to run higher, Morgan Stanley analyst Ravi Shanker said, noting that consensus numbers are “too low” given expectations of strong volume and cost tailwinds. Shanker upgraded Alaska Air to overweight from equal-weight and maintained overweights on Southwest Airlines, JetBlue Airways, Allegiant Travel and Delta Air Lines. Morgan Stanley sees about 30% upside to its price targets and 45% upside to consensus 2023 estimates, driven by a quick rebound of air traffic, structural cost savings and favorable jet fuel prices.
- Leidos Holdings was upgraded to buy from neutral at Goldman Sachs, which wrote that the IT services company should benefit as the Biden administration funds a modernization of technology in support of national security. Analyst Gavin Parsons sees strong bookings for Leidos over the next 24 months, and “significant upside” to the company’s 2021 free cash flow guidance. The stock’s valuation “doesn’t reflect the strengthening relative fundamentals,” the analyst wrote.
- Chemtrade was upgraded to outperform from sector perform at the Royal Bank of Canada (RBC) as the shares have lagged peers amid the “reopening trade,” which should lead to stronger financial results, analyst Nelson Ng wrote. RBC sees potential upside from the ultrapure acid business as the Biden administration supports an increase in domestic semiconductor fabrication facilities.
Threats
- Wall Street will see a correction before the bull market resumes and stocks end the year higher than current levels, Blackstone’s Byron Wien said in an interview with CNBC. Inflation will exceed most forecasts, leading to the Federal Reserve tightening its monetary policy and probably causing stocks to fall, said Wien, vice chairman of Blackstone Private Wealth Solutions.
- Vertex faces challenges from increasing competition and sports a valuation above peers, Morgan Stanley writes in note, cutting the stock to underweight. Analyst Stan Zlotsky says that while Vertex remains well-positioned with larger enterprises, a move down-market may be challenged by strong Cloud-native competitors.
- Bright Horizons cut to underweight from equal-weight at Morgan Stanley, which says in a note that the company’s employer-based childcare model faces uncertainties from changing workplace dynamics post-Covid. Changing work habits could result in daycare becoming more local to employee homes and lead to increased competition, adding pressure to top-line growth and driving multiple contraction.
Energy and Natural Resources Market
Strengths
- The best performing commodity for the week was lumber, up 11.31%. Lumber prices have been rising throughout the first quarter of 2021 amidst high demand.
- The International Renewable Energy Agency (IRENA) reported that renewable energy – mostly wind and solar – accounted for 82% of new electricity installation in 2020, marking a record amount of renewable energy capacity built in any year. China, the largest market for clean power and the world’s biggest polluter, built 72 gigawatts of wind energy and 49 gigawatts of solar in 2020. The U.S. installed 29 gigawatts of renewable energy, almost 80% more than in 2019.
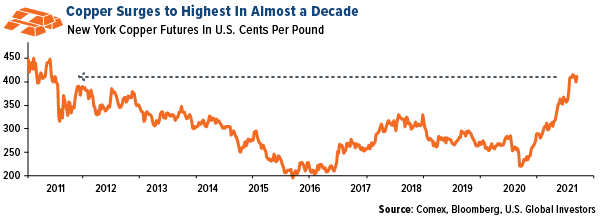
- Codelco, the world’s biggest producer of copper, is optimistic about keeping a consistent supply of the metal even with an increase in Covid-19 cases in Chile, which accounts for a quarter of global supply. In 2021, Codelco has been able to increase production at their mines by introducing shift changes, testing and tracing and delaying non-essential activities. Buoyed by strong demand from China in late 2020 and early 2021, copper surged to its highest levels in almost a decade in late February with anticipation of quick vaccine rollouts and President Biden’s infrastructure bill.
Weaknesses
- The worst performing commodity for the week was natural gas, down 4.62%. Natural gas futures posted a weekly loss on a mixed weather outlook that signals lower levels of demand for the power-plant and heating fuel.
- Oil had another weekly drop amidst a strengthening U.S. dollar while investors assess a mixed global demand picture, down approximately 3%. Head of futures division at Mizuho Securities said that inflation is going to take some purchasing power from the consumer and that will ultimately impact gasoline consumption. Concerns over inflation were heightened after U.S. producers posted a higher-than-expected rise in U.S. March producer prices. Even with the rollout of vaccines, countries throughout the world are experiencing an increase in Covid-19 cases and lockdowns are being reimposed throughout Europe and Asia. With the OPEC+ increasing daily production and the possibility of Iranian barrels returning to the market, there are concerns over reduced demand while supply is being increased.
- Bloomberg analysts believe that the current U.S. commitment towards increasing its wind and solar capacity by three-fold in the next 10 years is still not enough to reach President Biden’s goal of fully decarbonizing the country’s power system by 2035.
Opportunities
- Rio Tinto Group is moving closer to achieving industrial-scale production of battery-grade lithium from waste rock at a demonstration plant in California. Throughout 2021, Rio’s Boron mine will be run to assess feasibility of ramping up to a plant with capacity of at least 5,000 tons of lithium carbonate or enough to make batteries for about 70,000 electric vehicles, and that would make it the largest domestic source of the material in the U.S. Currently, Chile and Australia are the leading producers of lithium in the world, accounting for more than 70% of global operating capacity in 2020.
- Norway’s Equinor ASA and the U.K.’s SSE Plc are partnering to develop two new low-carbon power plants in the most polluting part of the U.K., the Humber region. Managing Director of SSE, Stephen Wheeler, said that by utilizing cutting-edge carbon capture and hydrogen solutions, the company can decarbonize power generation. The U.K. government has pledged at least $1.3 billion by the middle of the decade to be spent on funding at least one power project equipped with technology that captures the emissions and stores them permanently under the seabed. Keadby-3, the world’s first major 100% hydrogen-fired power station, is expected to have a peak demand of 1,800 megawatts of hydrogen and it will generate around 900 megawatts of electricity with zero emissions at the point of combustion.
- Saudi Arabia announced development plans for solar energy as it seeks to slash emissions and reduce its dependance on power generated from burning oil. The kingdom has signed seven agreements to produce electricity from solar power in various parts of the country, expected to add up to 3,670 megawatts of capacity. The switch to solar will decrease greenhouse gas emissions by more than 7 million tons.
Threats
- Total SE’s Port Arthur refinery on the Texas Gulf coast will have to keep its fluid catalytic cracking (FCC) refinery shut for another 4-5 weeks for emergency repairs. The FCC has been shut since March 26 after it reportedly had issues related to the mid-February winter storm that forced the refinery to shut for multiple weeks.
- Brazil is struggling to keep headline inflation below its 3.75% target for 2021, with the March year-over-year inflation coming in at 6.10%. High oil prices and a weak currency is putting the inflation under pressure, with fuel prices surging 11.23%, while cooking gas prices soared 4.98%.
- China’s producer price index (PPI) rose 4.4% year-over-year, after gaining 1.7% in February alone, higher than the 3.6% median estimate in a Bloomberg survey of economists. This rise in March is the most since July 2018, and it is driven by surging commodity costs. China’s rising prices threaten to stoke inflation around the world as it is the world’s biggest exporter.
Airline Sector
Strengths
- The best performing airline stock for the week was Embraer, up 14.9%. Air New Zealand has reported that business traffic has rebounded to 90% of normal levels. This is significantly higher than any other airline has announced. New Zealand has successfully handled COVID-19, and business travelers appear to prefer face-to-face meetings.
- U.S. air travel is continuing to accelerate; air travel was only down 56% year-over-year in March, which is up from a 60% drop in February. Delta’s announcement that it will no longer block the middle seat effective May 1 is a confirmation of this trend. The chart below shows the steady improvement witnessed since the depths of the airline crisis, which was March of last year.
- Data from the “Big Three” Chinese airlines indicates that traffic normalized in March 2021. Future capacity expansion plans call for a 20-40% increase from 2019 levels. Demand is 10-20% above 2019 levels, but yields are 90% of 2019 levels. International demand is 15-20% of normal levels, and some spare aircraft capacity is being converted to cargo aircraft.
Weaknesses
- The worst performing airline stock for the week was Norwegian Air Shuttle, down 15.5%. Estimates are being cut on Turkish Airlines by 10-15% in 2021 due to a very weak first quarter. The long-haul business, which is 45% of revenues, will take a very long time to recover. Net debt is $14.8 billion and should increase to $15.9 billion by year end.
- February international air travel dropped 89% year-over-year in March, a slowdown from the 86% drop witnessed in February. Europe was down 89%, Latin America was down 84%, Asia was down 95% and the Middle East was down 83%.
- Air France/KLM is indicating they may have an operating loss of 1.3 billion euro, with an EBITDA of negative 750 million for 2020. Liquidity is expected to be 8.8 billion euros. Traffic is being impacted by the third wave of COVID in Europe and additional travel restrictions between countries.
Opportunities
- KLM was able to recapitalize Air France with a capital injection of 1 billion euros. 3 billion euros of French state loans were converted into perpetual bonds. Air France will give up 18 slots, or 6% of its slots at Paris Orly airport. The carrier did state that it expects improved demand at the beginning of summer.
- Morgan Stanley upgraded the airline industry based on improved volume trends along with subdued jet fuel costs leading to significantly higher earnings. The airlines are leveraging off a low-cost base, and consensus estimates are 30% too low. Pent-up demand could drive traffic above 2019 levels. Corporate and international travel could surprise to the upside. 2022 capacity is expected to be equal to 2019 capacity.
- Air cargo continues to grow at 10% year-to-year and now is at 2018 levels. Global PMIs above 50 indicate that this trend will continue. Also, low inventory/sales ratios may shift some transported goods from ships to air cargo to make them timelier. Capacity is down 10% year-to-year for cargo due to parked commercial aircraft, and this is keeping prices elevated.
Threats
- Air Canada’s termination of its intent to acquire Air Transat may have a negative effect on the carrier. The breakup was triggered by the refusal of the European Commission to approve the deal. There may be some lost benefits from the potential increase in international and leisure flights, and there is also a $12.5 million breakup fee.
- Transat will now require an additional $500 million Canadian to get through 2021 and will also require some additional assistance from the Canadian government. The company indicated that it is in advanced stages on both fronts and should have these completed in the coming weeks. The company also indicated that it is free to pursue a sale with another acquirer.
- There may be some regionalized fare pressure in the coming months. Avelo Airlines, the first new mainline airline in the U.S. in 15 years, is offering fares as low as $19 one-way. The airline will be based out of Hollywood Burbank Airport.
Emerging Markets
Strengths
- The best performing country in emerging Europe for the week was Poland, gaining 1.4%. The best performing country in Asia this week was Pakistan, gaining 2%.
- The Polish zloty was the best performing currency in emerging Europe this week, gaining 2.5%. The South Korean won was the best performing currency in Asia this week, gaining 85 basis points.
- Eurozone investor confidence increased in April on expectations of faster vaccine rollouts and easing restrictions. The Sentix Investor Confidence Index jumped to 13.1 in April from 5.0 in March, way above expected reading of 6.7.
Weaknesses
- The worst performing country in emerging Europe for the week was Turkey, losing 2.6%.The worst performing country in Asia this week was Thailand, losing 1.8%.
- The Russian ruble was the worst performing currency in emerging Europe this week, losing 1.4%.The Indian rupee was the worst performing currency in Asia, losing 1.8%.
- China’s producer prices climbed in March by the most since July 2018 on surging commodity costs, adding to worries over rising global inflation as the pandemic recedes. China’s producer price index (PPI) number rose 4.4% versus expectations of 3.6% and just 1.7% in February.
Opportunities
- Europe is speeding up its vaccination efforts. Germany doubled the number of daily COVID-19 vaccinations, France hit a key immunization milestone a week ahead of schedule, and Italy is set to ease lockdown restrictions as contagion rates slow. Travel and leisure stocks hit a record high this week, as markets expect that this year’s tourist season will be stronger than last year. However, Eastern European countries are recording the highest number of COVID cases. Poland is struggling to cope with its highest number of new infections since the pandemic began, and Hungary now has one of the highest COVID mortality rates in the world.
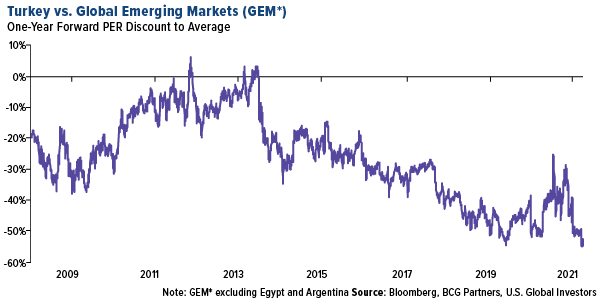
- Turkish equites became cheaper after the recent sell off, trading at an 8% discount to its five-year historical average and at a 51% discount to the global emerging market (GEM) median, according to PGC Capital. Given the macro uncertainty coupled with potential new corporate taxes, PGC Capital reduced earnings visibility but still sees a 19% upside potential. The broker expects economic activity to speed up in the second half of this year with rising tourism revenues, but the funding conditions are likely to remain tight.
- Wood & Company, an Eastern European broker, recommends selectively to buy Polish banks as the country may finally have a solution on how to convert Swiss Franc mortgages into Polish zloty. Thousands of Poles took out mortgages in Swiss francs more than a decade ago to take advantage of low interest rates in Switzerland. In 2008, the mortgages taken out in zlotys had an average annual interest rate of 8.7%, while similar Swiss franc-denominated loans issued by local banks had an average interest rate of 4.4%. Poland is the last country in Europe to face the problem that Hungary, Croatia and others tackled several years ago.
Threats
- Global funds sold China sovereign debt for first time in two years during March. Bloomberg discussed few possible reasons for that. First the surge in U.S. Treasury yields lessened China debt’s appeal. Second, FTSE Russell’s decision to take three years instead of the normal 12 months to integrate China sovereign debt into its indices soured investors’ appetite for Chinse bonds. Moreover, Beijing also announced a large sale of local government debt in March.
- The Financial Times reported that the PBOC has asked lenders operating in China to rein in credit supply. New yuan loan growth hit 16% in the first two month of this year, prompting the PBOC to instruct lenders to keep new loans in the first quarter at roughly the same level as 2020, which could translate into a considerable drop in credit. Small and foreign banks were asked to radically reduce loans to property buyers. Moreover, Bloomberg reported China’s regulators plan to impose additional capital requirements on the nation’s systemically important banks.
- U.S. added Chinese supercomputing companies to export blacklists, the first such move by the Biden administration to make it harder for China to obtain U.S. technology. Chinese entities are Tianjin Phytium Information Technology, Shanghai High-Performance Integrated Circuit Design Center, Sunway Microelectronics and the National Supercomputing Center branches. The Commerce Department said the groups were involved in building supercomputers used by Chinese "military actors" and facilitating programs to develop weapons of mass destruction.
Leaders and Laggards
| Index | Close | Weekly Change($) |
Weekly Change(%) |
|---|---|---|---|
| 10-Yr Treasury Bond | 1.65 | -0.02 | -1.08% |
| Oil Futures | 59.31 | -2.14 | -3.48% |
| Hang Seng Composite Index | 4,509.51 | -51.37 | -1.13% |
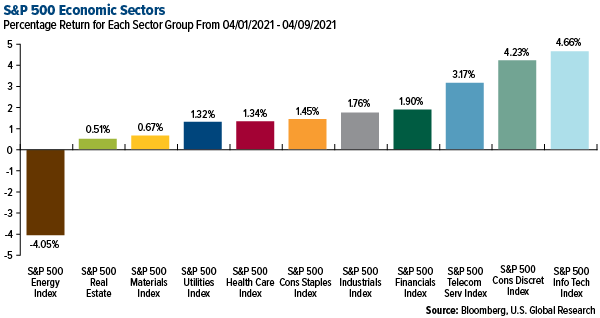
| S&P Basic Materials | 502.64 | +3.34 | +0.67% |
| Korean KOSPI Index | 3,131.88 | +44.48 | +1.44% |
| S&P Energy | 364.35 | -15.36 | -4.05% |
| Nasdaq | 13,900.19 | +420.08 | +3.12% |
| DJIA | 33,800.60 | +647.39 | +1.95% |
| Russell 2000 | 2,243.47 | -10.43 | -0.46% |
| S&P 500 | 4,128.77 | +108.90 | +2.71% |
| Gold Futures | 1,743.50 | +15.10 | +0.87% |
| XAU | 143.76 | +3.83 | +2.74% |
| S&P/TSX VENTURE COMP IDX | 959.37 | -1.47 | -0.15% |
| S&P/TSX Global Gold Index | 301.86 | +6.50 | +2.20% |
| Natural Gas Futures | 2.52 | -0.12 | -4.59% |
| Index | Close | Monthly Change($) |
Monthly Change(%) |
|---|---|---|---|
| Korean KOSPI Index | 3,131.88 | +173.76 | +5.87% |
| 10-Yr Treasury Bond | 1.65 | +0.13 | +8.82% |
| Gold Futures | 1,743.50 | +19.00 | +1.10% |
| S&P Basic Materials | 502.64 | +13.82 | +2.83% |
| S&P 500 | 4,128.77 | +229.96 | +5.90% |
| DJIA | 33,800.60 | +1,503.58 | +4.66% |
| Nasdaq | 13,900.19 | +831.36 | +6.36% |
| Oil Futures | 59.31 | -5.13 | -7.96% |
| Hang Seng Composite Index | 4,509.51 | +23.80 | +0.53% |
| S&P/TSX Global Gold Index | 301.86 | +17.55 | +6.17% |
| XAU | 143.76 | +8.11 | +5.98% |
| Russell 2000 | 2,243.47 | -42.21 | -1.85% |
| S&P Energy | 364.35 | -35.45 | -8.87% |
| S&P/TSX VENTURE COMP IDX | 959.37 | -8.86 | -0.92% |
| Natural Gas Futures | 2.52 | -0.17 | -6.46% |
| Index | Close | Quarterly Change($) |
Quarterly Change(%) |
|---|---|---|---|
| XAU | 143.76 | -10.76 | -6.96% |
| S&P/TSX Global Gold Index | 301.86 | -33.54 | -10.00% |
| Gold Futures | 1,743.50 | -177.60 | -9.24% |
| DJIA | 33,800.60 | +2,759.47 | +8.89% |
| S&P 500 | 4,128.77 | +324.98 | +8.54% |
| Nasdaq | 13,900.19 | +832.71 | +6.37% |
| Korean KOSPI Index | 3,131.88 | +100.20 | +3.31% |
| Natural Gas Futures | 2.52 | -0.21 | -7.73% |
| S&P Basic Materials | 502.64 | +18.60 | +3.84% |
| Russell 2000 | 2,243.47 | +146.59 | +6.99% |
| Oil Futures | 59.31 | +8.48 | +16.68% |
| Hang Seng Composite Index | 4,509.51 | +145.92 | +3.34% |
| S&P/TSX VENTURE COMP IDX | 959.37 | +44.30 | +4.84% |
| S&P Energy | 364.35 | +51.29 | +16.38% |
| 10-Yr Treasury Bond | 1.65 | +0.57 | +53.01% |
U.S. Global Investors, Inc. is an investment adviser registered with the Securities and Exchange Commission ("SEC"). This does not mean that we are sponsored, recommended, or approved by the SEC, or that our abilities or qualifications in any respect have been passed upon by the SEC or any officer of the SEC.
This commentary should not be considered a solicitation or offering of any investment product.
Certain materials in this commentary may contain dated information. The information provided was current at the time of publication.
Some links above may be directed to third-party websites. U.S. Global Investors does not endorse all information supplied by these websites and is not responsible for their content.
Holdings may change daily. Holdings are reported as of the most recent quarter-end. The following securities mentioned in the article were held by one or more accounts managed by U.S. Global Investors as of (12/31/2020):
Daimler AG
Tesla Inc.
Bayerische Motoren Werke AG
MMC Norilsk Nickel PJSC
Air Canada
Alaska Air Group Inc
Southwest Airlines Inc
JetBlue Airways Corp
Allegiant Travel Co
Delta Air Lines Inc
Equinor ASA
Total SE
*The above-mentioned indices are not total returns. These returns reflect simple appreciation only and do not reflect dividend reinvestment. The Dow Jones Industrial Average is a price-weighted average of 30 blue chip stocks that are generally leaders in their industry. The S&P 500 Stock Index is a widely recognized capitalization-weighted index of 500 common stock prices in U.S. companies. The Nasdaq Composite Index is a capitalization-weighted index of all Nasdaq National Market and SmallCap stocks. The Russell 2000 Index® is a U.S. equity index measuring the performance of the 2,000 smallest companies in the Russell 3000®, a widely recognized small-cap index. The Hang Seng Composite Index is a market capitalization-weighted index that comprises the top 200 companies listed on Stock Exchange of Hong Kong, based on average market cap for the 12 months. The Taiwan Stock Exchange Index is a capitalization-weighted index of all listed common shares traded on the Taiwan Stock Exchange. The Korea Stock Price Index is a capitalization-weighted index of all common shares and preferred shares on the Korean Stock Exchanges. The Philadelphia Stock Exchange Gold and Silver Index (XAU) is a capitalization-weighted index that includes the leading companies involved in the mining of gold and silver. The U.S. Trade Weighted Dollar Index provides a general indication of the international value of the U.S. dollar. The S&P/TSX Canadian Gold Capped Sector Index is a modified capitalization-weighted index, whose equity weights are capped 25 percent and index constituents are derived from a subset stock pool of S&P/TSX Composite Index stocks. The S&P 500 Energy Index is a capitalization-weighted index that tracks the companies in the energy sector as a subset of the S&P 500. The S&P 500 Materials Index is a capitalization-weighted index that tracks the companies in the material sector as a subset of the S&P 500. The S&P 500 Financials Index is a capitalization-weighted index. The index was developed with a base level of 10 for the 1941-43 base period. The S&P 500 Industrials Index is a Materials Index is a capitalization-weighted index that tracks the companies in the industrial sector as a subset of the S&P 500. The S&P 500 Consumer Discretionary Index is a capitalization-weighted index that tracks the companies in the consumer discretionary sector as a subset of the S&P 500. The S&P 500 Information Technology Index is a capitalization-weighted index that tracks the companies in the information technology sector as a subset of the S&P 500. The S&P 500 Consumer Staples Index is a Materials Index is a capitalization-weighted index that tracks the companies in the consumer staples sector as a subset of the S&P 500. The S&P 500 Utilities Index is a capitalization-weighted index that tracks the companies in the utilities sector as a subset of the S&P 500. The S&P 500 Healthcare Index is a capitalization-weighted index that tracks the companies in the healthcare sector as a subset of the S&P 500. The S&P 500 Telecom Index is a Materials Index is a capitalization-weighted index that tracks the companies in the telecom sector as a subset of the S&P 500. The NYSE Arca Gold Miners Index is a modified market capitalization weighted index comprised of publicly traded companies involved primarily in the mining for gold and silver. The Consumer Price Index (CPI) is one of the most widely recognized price measures for tracking the price of a market basket of goods and services purchased by individuals. The weights of components are based on consumer spending patterns. The Purchasing Manager’s Index is an indicator of the economic health of the manufacturing sector. The PMI index is based on five major indicators: new orders, inventory levels, production, supplier deliveries and the employment environment. The S&P/TSX Venture Composite Index is a broad market indicator for the Canadian venture capital market. The index is market capitalization weighted and, at its inception, included 531 companies. A quarterly revision process is used to remove companies that comprise less than 0.05% of the weight of the index, and add companies whose weight, when included, will be greater than 0.05% of the index. Gross domestic product (GDP) is the monetary value of all the finished goods and services produced within a country’s borders in a specific time period, though GDP is usually calculated on an annual basis. It includes all of private and public consumption, government outlays, investments and exports less imports that occur within a defined territory.
A seasonally adjusted annual rate (SAAR) is a rate adjustment used for economic or business data, such as sales numbers or employment figures, that attempts to remove seasonal variations in the data. The Manheim Used Vehicle Value Index is a measurement of used vehicle prices that is independent of underlying shifts in the characteristics of vehicles being sold. Statistical analysis is applied to its database of more than 5 million used vehicle transactions annually. The Sentix Investor Confidence Index rates the relative six-month economic outlook for the euro zone. A producer price index (PPI) is a price index that measures the average changes in prices received by domestic producers for their output.


