


Big Investors Dump Bitcoin for Gold as Inflation Heats Up
Date Posted: May 21, 2021
Read time: 51 min
One of the biggest reasons why people invest in assets like gold, Bitcoin and altcoins is because they act as hedges against bad government policy. Look at Venezuela. The beleaguered country's currency, the bolivar, isn't worth the paper it's printed on due to draconian socialist policies. As such, an outsized percentage of Venezuelans rely on Bitcoin as a store of value and to help make ends meet.
By Frank Holmes
CEO and Chief Investment Officer
U.S. Global Investors

One of the biggest reasons why people invest in assets like gold, Bitcoin and altcoins is because they act as hedges against bad government policy.
Look at Venezuela. The beleaguered country’s currency, the bolivar, isn’t worth the paper it’s printed on due to draconian socialist policies. As such, an outsized percentage of Venezuelans rely on Bitcoin as a store of value and to help make ends meet.
A less severe example—though no less impactful—is Canada. In case you haven’t heard, there’s a new bill being considered, C-10, that some critics worry could lead to the Canadian government’s regulation of the content you post on YouTube, Facebook and other social media sites. Although the bill’s main advocate, Heritage Minister Steven Guilbeault, has tried to make it “crystal clear” that the government seeks only to oversee “professional” content creators and not everyday social media users, fears persist that people’s freedom of speech is in jeopardy.
Even Google, which owns YouTube, has voiced concerns. “We remain concerned about the unintended consequences, particularly with regards to the potential effects on Canadians’ expressive rights,” the company said in a statement.
This is precisely what members of the crypto community call FUD, or fear, uncertainty and doubt.
Normally used to refer to something or someone who tries to spread negative information about crypto (Elon Musk?), FUD also summarizes how Canadians feel about the proposed legislation.
The Bitcoin Pullback Is Normal and Healthy
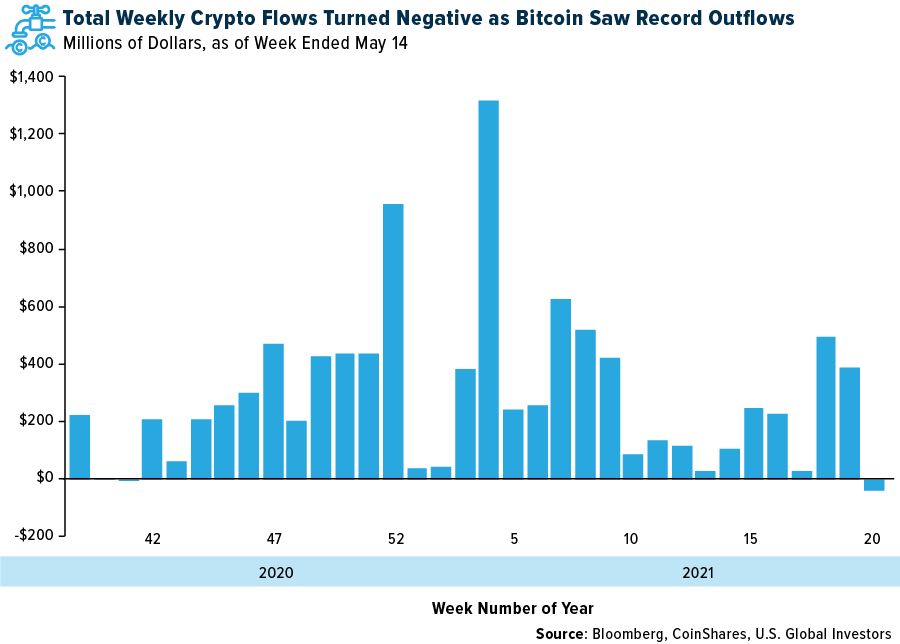
Speaking of Elon Musk, investors yanked $98 million out of Bitcoin investment products last week, the most on record, after the Tesla chief announced in a tweet that he was suspending vehicle purchases using the cryptocurrency. This amount was enough to offset net inflows of $48 million into all other digital asset funds. Ether funds, for instance, attracted $27 million, bringing the crypto’s weekly trading volume to an incredible $4.1 billion, the most ever, according to CoinShares.
Bitcoin came under pressure from more than just Musk’s distorted comments on its energy usage. The Chinese government has also cracked down on the crypto ecosystem, banning financial institutions from providing services related to digital assets. A hotline has even been set up in one Chinese province that people can use to snitch on neighbors they suspect of mining cryptos.
Of course, this is only the 10,000th time China has come out against crypto. More FUD.
The week’s selloff was dramatic. By Wednesday, Bitcoin was down more than 40% from its all-time high of $64,000, set in mid-April. The token’s market dominance fell to a three-year low of 40%.
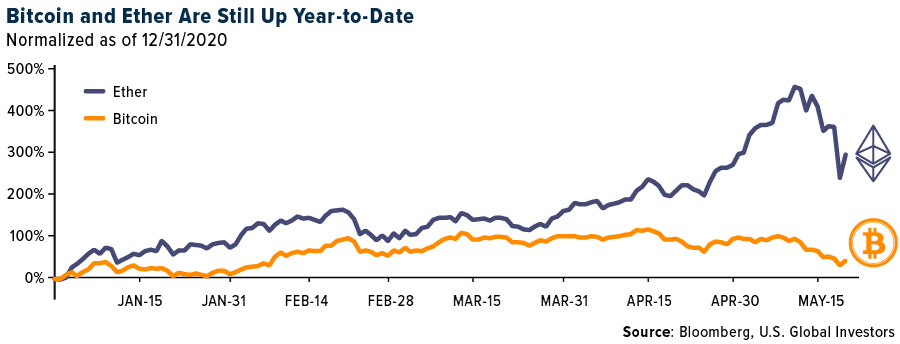
I believe the pullback is healthy. It’s important for investors to remember that this kind of volatility is normal for such a still-emerging, speculative asset class. It’s also important to keep things in perspective: Bitcoin is still up around 30% so far this year, close to 300% for the 12-month period.
Institutional Investors Rediscovering Gold
So where have all the millions that have flowed out of crypto funds gone to? Would you be surprised to hear gold?
According to an analysis of CME futures contract, large institutional investors could be shifting away from Bitcoin in favor of gold. “Over the past month, Bitcoin futures markets experienced their steepest and more sustained liquidation since the Bitcoin ascent started last October,” JPMorgan wrote in a recent note to investors. These liquidations have corresponded with inflows into gold ETFs.
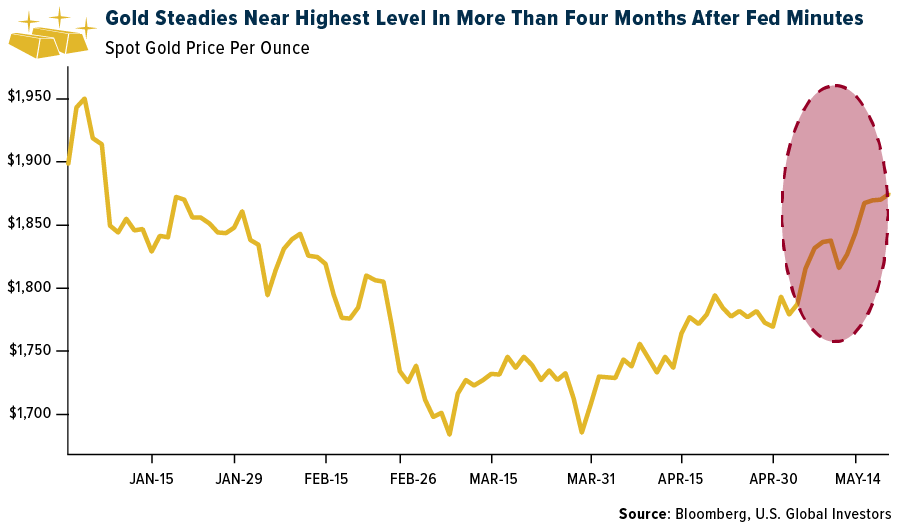
The price of the yellow metal broke through resistance this week, touching $1,890 an ounce for the first time since January on a declining U.S. dollar. The next test is $1,900, and after that, its all-time high of $2,067.
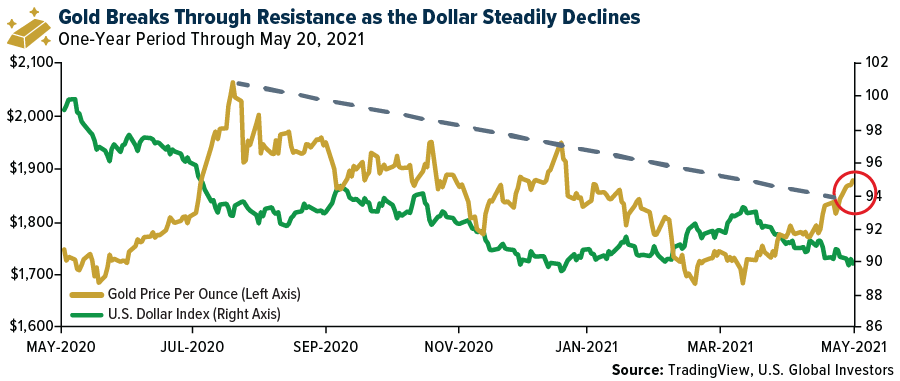
Whereas Bitcoin is a speculative asset, gold is a well-established, highly liquid asset with a centuries-long track record. We know what the price drivers are.
Besides responding to a weaker dollar, gold is finding traction from ongoing unprecedented money-printing and monetary stimulus. The amount of M2 money circulating the U.S. economy is up about 21% from a year ago. Meanwhile, the Federal Reserve maintains its bond-buying program. As of this week, the size of the central bank’s balance sheet was just under a staggering $8 trillion.
More Inflation Warnings
Inflation also continues to weigh on investors’ minds, improving the investment case for gold. This week we saw even more data emerge warning markets that prices could be headed higher in the near term.
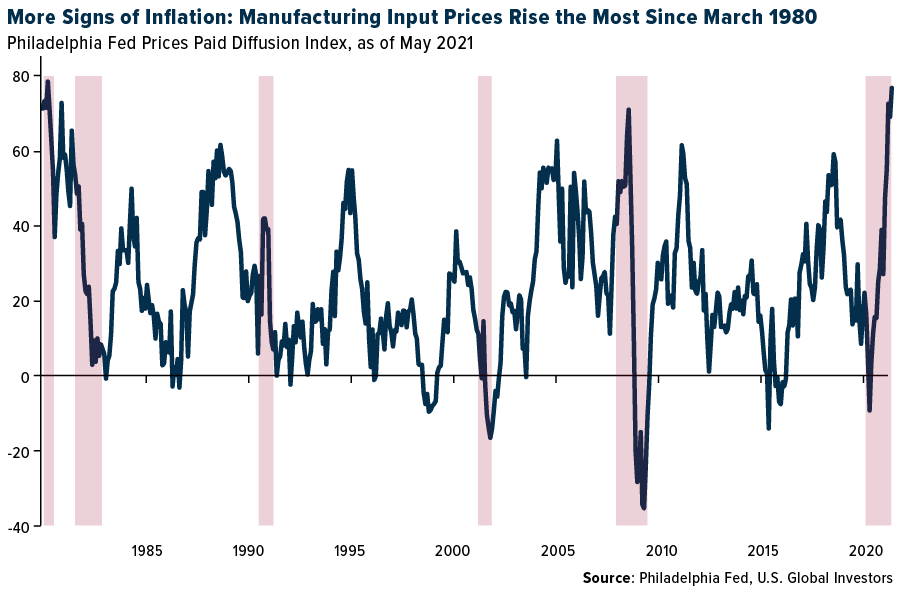
For one, input prices for manufacturers in the Philadelphia region accelerated at their fastest pace in over 40 years. The Philly Fed’s prices paid diffusion index rose to 76.8 this month, the highest reading since March 1980. Three quarters of manufacturers reported price increases while none reported decreases. Expect these higher costs to be passed on to consumers.
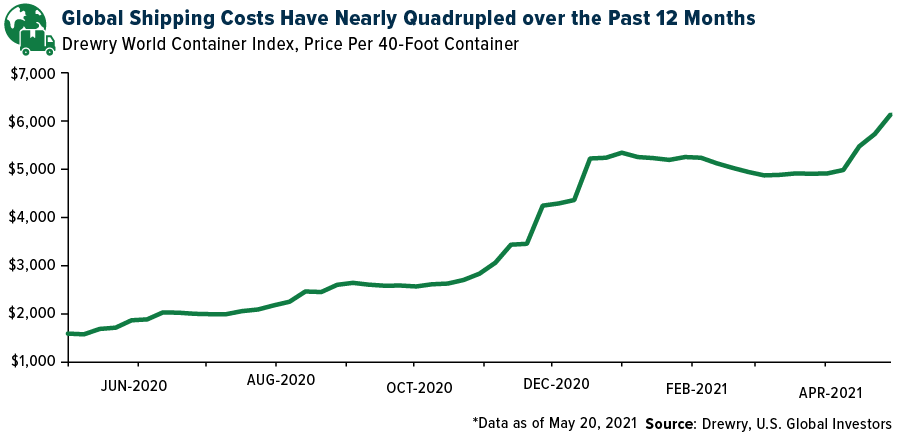
Much of the price increases could be related to record and near-record shipping costs. The rate to ship a 40-foot container continues to climb as demand far outpaces supply. The Drewry World Container Index rose 7% during the week ended Thursday to touch $5,193, a nearly fourfold increase from a year earlier.
Freight rates from Shanghai to Rotterdam reached a new all-time high of $9,865 per 40-foot container.
Fuel costs have also been rising in the wake of the cyberattack on the Colonial Pipeline, which delivers 45% of gas supply to the Southeast. This week, GasBuddy predicted that gas prices would be at their most expensive this Memorial Day weekend in seven years. Gas will average $2.98 per gallon later this month, the company said, the most since 2014 when it was $3.66. This could have the effect of discouraging some fully vaccinated families from taking a well-deserved summer road trip.
American Airlines Passengers Can Now Verify Vaccination Status Using VeriFLY
While I’m on the topic of travel, this summer could mark the turnaround we’ve been hoping for in terms of commercial flight demand. As I’ve already shared with you, the European Union plans to reopen its borders to fully vaccinated visitors, and this week, American Airlines announced that it’s now allowing passengers to use the VeriFLY app to verify their vaccination status before flying. This gives customers travel access to the Bahamas, El Salvador and Guatemala. Wheels up!
Did you know there are no publicly traded airports in the U.S.? Elsewhere, it’s a different story. Meet 20 publicly traded airports around the world by watching our latest video here.
Gold Market
This week, spot gold closed at $1,881.25, up $37.82 per ounce, or 2.05%. Gold stocks, as measured by the NYSE Arca Gold Miners Index, ended the week higher by 4.02%. The S&P/TSX Venture Index came in up 2.77%. The U.S. Trade-Weighted Dollar fell 0.31%.
| Date | Event | Survey | Actual | Prior |
|---|---|---|---|---|
| May-16 | China Retail Sales YoY | 25.0% | 17.7% | 34.2% |
| May-18 | Housing Starts | 1704k | 1569k | 1733k |
| May–19 | Eurozone CPI Core YoY | 0.8% | 0.7% | 0.8% |
| May-20 | Initial Jobless Claims | 450k | 444k | 478k |
| May-25 | New Home Sales | 950k | — | 1021k |
| May-25 | Conf. Board Consumer Confidence | 119.8 | — | 121.7 |
| May-27 | Hong Kong Exports YoY | 26.6% | — | 26.4% |
| May-27 | Durable Goods Orders | 0.8% | — | 0.8% |
| May-27 | GDP Annualized QoQ | 6.4% | — | 6.4% |
| May-27 | Initial Jobless Claims | 425k | — | 444k |
Strengths
- The best performing precious metal for the week was gold, up 2.05%. The metal rose to a three-month high as lower bond yields helped to improve gold prices. Continuing concerns about rising inflation are buoying the metal as well. Flows in gold ETFs are continuing to increase. Gold ETFs recorded inflows of 442,000 ounces. Net long gold positions increased by 29,000 to 204,000 contracts. In addition, according to J.P. Morgan, investors have been pulling money out of bitcoin and buying gold as a replacement. China’s gold imports tripled from the prior month. In a recent note, BMO Capital Markets indicates that gold does well in inflationary environments and producers may have record cash flow over the next year.
- Anglo American’s De Beers business sold $380 million of rough diamonds at its fourth auction this year. The third sale was for $450 million. Only $56 million of diamonds were sold in all of 2020. Demand from India may be down in 2021 due to the COVID surge.
- The World Platinum Investment Council (WPIC) said the global platinum market will be more undersupplied this year than it previously thought as economic recovery fuels a surge in demand from industry. The roughly 8 million ounce a year market will see a shortfall of 158,000 ounces in 2021, the third consecutive annual deficit, the WPIC said in its latest quarterly report. Three months ago, it forecast undersupply of 60,000 ounces in 2021. Additionally, UBS increased its forecasts for platinum based on these same trends. ETF flows into platinum are up 3% this year.
Weaknesses
- Despite the positive forecast from the WPIC, the worst performing precious metal for the week was platinum, down 4.66%. Centerra Gold said on Sunday it has initiated binding arbitration against Kyrgyzstan government after the parliament passed a law allowing the state to temporarily take over the country’s biggest industrial enterprise, the Kumtor gold mine operated by Centerra. Given these restrictions, Centerra is no longer in control of the mine. Centerra has suspended its 2021 guidance and three-year outlook relating to Kumtor. Kumtor earnings are being removed from Centerra and estimates are being reduced. Most investors who have traded Centerra in the past, based on past government interventions, seem to expect a more reasonable outcome as the share price of Centerra is up nearly 17% since the initial ownership dispute was brough to light a couple weeks ago.
- American Gold and Silver reported disappointing first quarter results: a loss of $0.08 per share versus a consensus of $0.06 loss per share. Relief Canyon production of gold was 1,300 ounces, as opposed to an 8,200-ounce consensus. Additionally, the company took an $83 million write-down on this property. Its share price finished the week off nearly 25%.
- St Barbara Ltd. said that it has lowered its full-year production guidance but increased its all-in sustaining costs forecast due to guidance adjustments at its Leonora and Simberi operations. The company lowered its consolidated gold production guidance to between 330,000 ounces and 360,000 ounces from the previous guidance of between 370,000 ounces and 380,000 ounces, and increased its all-in sustaining costs forecast to a range between A$1,547 per ounce and A$1,695 per ounce from the previous estimate of A$1,440 per ounce to A$1,520 per ounce.
Opportunities
- Arizona Metals reported the discovery of a new high-grade gold and zinc zone at its 100% owned Kay Mine property in Arizona. In a sure sign of the project’s potential to add significant tonnage, potentially at improved grades, most of the mineralized intervals in the drilled holes are in an area that has historically seen very little exploration. Arizona Metals is funded for 75,000 meters of drilling to infill and expand the resource footprint.
- Platinum may be increasingly used instead of more expensive palladium in vehicles, according to Johnson Matthey. Platinum is about half the price of palladium. Chinese automakers appear to be taking the lead with this shift. Platinum supply will fall short of demand again this year, the World Platinum Investment Council said in a report. The market may have a shortage of 158,000 ounces.
- Diamond inventories have dropped to cycle low levels, which creates a positive environment for pricing towards the end of this year. Easing Covid restrictions in the U.S. and Europe may release pent-up demand from weddings, which may drive strong jewelry demand in the second half of the year.
Threats
- Rising labor costs may begin to occur at many mines. This is most acute in Australia and Brazil, according to the CEOs of Newmont and AngloGold Ashanti. In addition, South Africa’s Union of Mineworkers has asked for a 15% annual wage increase through 2023. Citi’s Economic Surprise Index, which measures whether economic data is missing or beating expectations, is now at its lowest level in a year. This implies that the strength of the economy is no longer running above expectations. Any new economic misses might surprise the market on “Where’s the post-pandemic growth?”
- When China’s Zijin Mining paid $1 billion to buy an extensive gold mine in the Colombian Andes in late 2019, security risks were a top concern, despite an operation by the military which had beat back illegal miners. Illegal extraction by wildcat miners in tunnels either within or adjoining its concession has increased. The tunnels are controlled by the Clan del Golfo crime gang, known locally as “The Ten” for the 10% cut they take off the illegal miner’s output.
- UBS initiated coverage of platinum miners with a neutral stance, as they see supply demand imbalances easing in the next two years on supply increases from South Africa and Russia. The bank sees prices for palladium easing to $2,000 in the longer term. UBS analysts have kept their yearend forecast for gold at $1,600 an ounce, saying they “expect fading inflation surprises, higher U.S. government bond yields, rising vaccination pace to reduce uncertainty and the U.S. dollar to peak.” Consumers certainly feel inflation now as rents for single-family homes in the U.S. have risen to their highest level since 2006, with a 4.3% jump from the prior year.

Index Summary
- The major market indices finished mixed this week. The Dow Jones Industrial Average lost 0.51%. The S&P 500 Stock Index lost 0.43%, while the Nasdaq Composite climbed 0.31%. The Russell 2000 small capitalization index lost 0.42% this week.
- The Hang Seng Composite rose 2.59% this week; while Taiwan was up 3.00% and the KOSPI rose 0.10%.
- The 10-year Treasury bond yield remained flat at 1.624%.
Blockchain and Digital Currencies
Strengths
- Of the cryptocurrencies tracked by CoinMarketCap, the best performer for the week was Polygon, rising 10.48%.
- The National Bank of Egypt (NBE) will use Ripple’s blockchain technology, RippleNet, to create a remittance corridor with the United Arab Emirates (UAE). Ripple reported that the NBE will partner with Abu Dhabi-based LuLu International Exchange in the UAE to serve the large number of Egyptians working there. Citing World Bank Group’s report, Ripple said that the remittances to Egypt in 2020 reached $24 billion. By joining RippleNet, NBE and LuLu get access to cheaper, quicker, and reliable payments.
- Figure Technologies, a California-based blockchain lending startup, completed its Series D funding round, announcing that it raised $200 million at a valuation of $3.2 billion. Figure’s Provenance blockchain acts as a marketplace for loans and mortgages, capital table and fund management, and banking and payments. The fintech startup has also applied for a U.S. banking charter, which is currently under review at the Office of the Comptroller of the Currency (OCC).
Weaknesses
- Of the cryptocurrencies tracked by CoinMarketCap, the worst performer for the week was Shiba Inu, down 54.34%.
- The Federal Trade Commission (FTC) issued a consumer protection warning regarding the increased volume of cryptocurrency scams during the current bull run. The report claims that since October 2020, around 7,000 people have reported losses of more than $80 million on such scams, with the median loss of almost $1,900. The FTC added that these losses have risen 1,000% year-over-year, with reports of people sending more than $2 million in cryptocurrencies to Elon Musk impersonators over the past six months. The scams range from fake promises of increasing someone’s investment if they send crypto to the scammer’s wallet to scammers using online dating sites to catfish people and present false cryptocurrency investment opportunities.
- Bitcoin, Ether, and other altcoins saw massive selloffs this week as the total cryptocurrency market capitalization dropped by more than $1 trillion from last week’s all-time high of $2.5 trillion. During the week, Bitcoin dropped by 26.87% while Ether’s price slumped by more than 40%. The chart below shows that even with the current price drop, both Bitcoin and Ether have provided significant returns to their investors.
Opportunities
- Commerzbank, which is Germany’s second biggest bank, announced that it partnered with chemical firms Evonik and BASF SE to test the use of its blockchain technology and programmable money in a bid to manage supply chains between the two companies. The bank reported that transactions were done in an automated and digital manner, using programmable digital euros on Commerzbank’s blockchain platform. Commerzbank was able to generate a thorough and tamper-proof depiction of business processes after receiving data from the two chemical companies, with smart contracts validating the transactions. As a result of the successful pilot, Evonik and BASF SE have agreed to expand the testing to other supply chain partners.
- Vermont-based Teucrium Trading filed an application with the U.S. Securities and Exchange Commission (SEC) to list a bitcoin futures exchange-traded fund (ETF). Teucrium Trading, which also has agriculture-related ETFs, plans to list the Teucrium Bitcoin Futures Fund (BCFU) on the NYSE Arca, and it would track a benchmark of Bitcoin futures contracts. Although the SEC has not approved any bitcoin-related ETFs yet, Teucrium believes that its fund’s objective to track the largest cryptocurrency’s futures market might have an advantage over other applications that propose ETFs that are physically backed by Bitcoin.
- The Nebraska state legislature voted to pass a bill which proposed creating a new state bank charter for digital asset depository institutions, providing consumers and institutions places to custody their digital assets. Additionally, the bill will allow existing state-chartered banks in the state to open crypto banking divisions. The digital asset banks in Nebraska will not accept deposits or lend in fiat currencies and will be required to hold 100% of its assets in reserves.
Threats
- The Chairman of the Senate Banking Committee, Senator Sherrod Brown, sent an open letter to the Acting Comptroller at the Office of the Comptroller of the Currency (OCC) regarding concerns about the OCC granting national trust charters to cryptocurrency companies. In the past five months, the OCC has granted conditional trust charters to Anchorage, Paxos and Protego, and Sen. Brown requested that Michael Hsu, the Acting Comptroller, should reassess the grants. The letter also said that it was unclear whether the OCC had conducted thorough due diligence before approving the three conditional charters. Sen. Brown pointed out in the letter that the OCC is not capable of regulating these entities as traditional banks due to the volatility of digital asset valuations and the disproportionate influence that individuals have on entire cryptocurrency markets.
- The Iranian government has enlisted the nation’s Ministry of Intelligence in a bid to crack down on illegal crypto miners operating within its borders. The Ministry is said to be involved in setting up committees and task forces to locate and seize mining farms that operate without a license. Iran’s power grid has been put under considerable strain as the Middle Eastern nation used crypto mining to boost its sanction-hit economy, and the strain has only exacerbated this year due to reduced rainfall, limiting supply of hydroelectricity. Crypto miners in Iran account for 3.82% of Bitcoin’s total hash rate.
- Hong Kong’s Financial Services and the Treasury Bureau (FSTB) released a report this week calling for a thorough licensing regime for cryptocurrency exchanges while limiting trading only to qualified investors, which refers to individuals with portfolios worth more than $1 million as per Hong Kong law. If the legislators pass a law based on FSTB’s recommendations, up to 93% of Hong Kong’s population would be denied access to cryptocurrencies. Additionally, the city’s government is planning to allow its Securities and Futures Commission (SFC) to withdraw licenses of already authorized crypto exchanges at will.

Domestic Economy and Equities
Strengths
- Initial jobless claims fell for a third straight week, down 34,000 week-over-week to a fresh post-pandemic low of 444,000, beating estimates of 450,000.
- The United States released strong PMI data. The Preliminary Manufacturing PMI increased to 61.5 in May from 60.5 in April. The Service PMI surged to 70.1 from 54.7. The Composite PMI, which combines service and manufacturing activities, was released at 68.1 versus the prior reading of 63.5.
- Enphase Energy Inc., a solar panel manufacturer, was the best performing S&P 500 stock for the week, increasing 19%. Shares of Enphase Energy Inc., and other solar industry names, potentially gained on optimism toward President Biden’s clean energy plan.
Weaknesses
- The Prices Paid Index increased 8 points to 76.8 this week, the highest since March 1980, as 77% of firms reported increases in input prices, and none reported decreases. The major narrative this week continues to revolve around perceptions of higher inflation risks. However, the inflation fears could be overdone. Some market observers view the spike in inflation as transitory and expect lower CPI numbers toward the end of the year.
- U.S. housing starts slid 9.5% in April to an annualized rate of 1.57 million units, the Census Bureau said Tuesday. That is well below the median estimate of a 1.7-million-unit pace from economists surveyed by Bloomberg. March’s huge upswing was revised slightly lower to a rate of 1.73 million.
- Discovery Inc, was the worst performing S&P 500 stock for the week, decreasing 11.7%. Shares were down on news that AT&T will spin off its media operations and merge them with Discovery Inc.
Opportunities
- U.S. nonfarm payrolls will be released next Friday. The number of U.S. employees on nonfarm payrolls is expected to increase by 600,000 in May, from just 266,000 new jobs added in April. Unemployment data will be released next Friday as well, and Bloomberg economists predict unemployment to decline in May to 5.9% from 6.1% in the prior month. The labor market should continue to improve.
- The U.S. economy should continue to recover for the rest of the year as manufacturing and services are expected to expand, according to an Institute for Supply Management forecast released Tuesday. “Expectations for the remainder of 2021 have strengthened somewhat. Compared to December 2020, there is hope that the corner has been turned on the coronavirus pandemic; both manufacturing and services sectors are signaling expansion,” ISM said.
- The U.S. and South Korea announced a partnership in a range of industries, including pharmaceutical companies making COVID-19 vaccinations as well as semiconductor producers, writes Bloomberg. South Korea is eager to secure supplies of COVID-19 vaccines that the U.S. has recently allowed to be exported. At the same time, South Korea will help the U.S. to alleviate a semiconductor shortage that led to disruption in car factories across North America. In addition, South Korea may build a chip making plan near Austin, TX, a $17 billion investment.
Threats
- Several Federal Reserve officials said at the central bank’s latest April meeting that it could soon be time to discuss a plan for reducing the Fed’s massive bond-buying program, according to minutes of the discussion released Wednesday. Officials generally said the U.S. economy remained “far” from its twin goals of full employment and price stability, and still required very loose monetary policy. However, several argued that the time might come relatively soon for the Fed to change its stance.
- The U.S. housing market is hot. Across the U.S. home prices are skyrocketing and construction costs are climbing quickly. Companies including D.R. Horton Inc. and Lennar Corporation are experimenting with blind auctions in areas such as Texas, Florida, and southern California. Some smaller firms have stopped signing contracts altogether. 30-year mortgage rates remain relatively close to the record low of 2.65% in early January.
- Bank of America’s latest Flow Show report noted that $1.1 billion has left technology funds in the week-ended May 19, which is the most since December 2018. The Global Fund Manager Survey noted investors have pared overweight positions on tech stocks to a three-year low. Despite the positioning dynamics, tech is one of the better performers this week. There has been skepticism about a sustained rotation out of the space given the favorable structural growth profile of the big tech names, FactSet reported.
Energy and Natural Resources Market
Strengths
- The best performing commodity for the week was tin, up 4.95%. Traders are expecting tin prices to continue their upward momentum, as the week saw a demand increase from China, Japan, South Korea, Taiwan, and Europe.
- Raw materials exchange-traded products (ETPs) account for more than half of the 20 best-performing ETPs this year. In May alone, investors allocated around $2.6 billion to track everything from lumber and corn to oil and iron as consumer activity and construction surges, and supply chain bottlenecks intensify. This week saw the filing of at least four exchange-traded funds (ETFs) that track commodities and even companies that transport commodities in bulk. Data compiled by Bloomberg depicts that commodity ETPs are luring the most cash since August 2020, marking a drastic shift from last year when technology and thematic ETFs took center stage as economies were being ravaged by the pandemic.
- Adani Green Energy Ltd. announced that the company has acquired SoftBank’s renewables business in India at a valuation of $3.5 billion, making it the largest deal in India’s clean power sector. The move is set to push Adani closer to its ambition of becoming the world’s largest solar power producer by 2025. The deal to acquire SB Energy Holdings, in which SoftBank holds 80%, includes 1,400 megawatts (MW) of operational solar projects and 3,554 MW under construction. The pipeline also includes 324MW wind and 450MW of wind-solar hybrid. SB Energy’s total portfolio has 5 gigawatts (GW) of total renewable capacity.
Weaknesses
- The worst performing commodity for the week was palm oil, down 6.86%. Palm oil posted its worst week in more than a year as soy markets slumped and investors showed concerns over resurgence in COVID-19 cases, which could dampen demand.
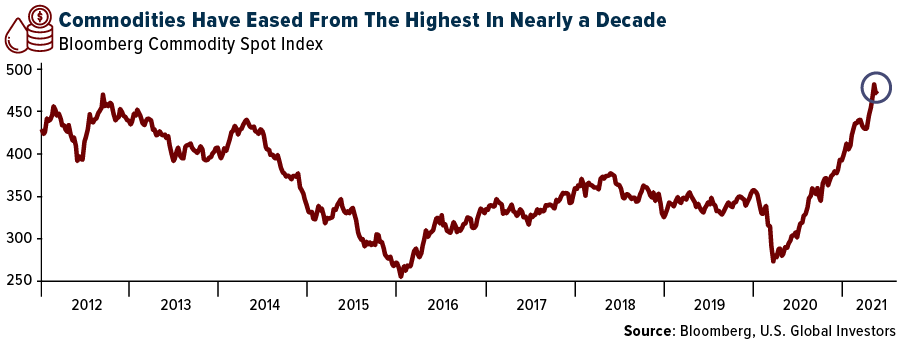
- The recent commodities rally is facing downward pressure as the Bloomberg Commodity Spot Index slid more than 3% a week after reaching almost ten-year highs last week. This cooling off is being attributed to global worries about inflation, the U.S. Federal Reserve hinting at easing stimulus and possibly debating tapering at future meetings, along with the Chinese government calling for stringent measures to stabilize spiking prices. The chart below shows that although commodities have eased this week, the recent year-long boom in prices could have more room to run.
- Oil is on track to post its biggest weekly decline in at least a month as the market expects the U.S. to lift sanctions against Iranian crude. West Texas Intermediate (WTI) futures were down 2.25% this week, with Brent futures in London posting their worst week since March, dropping 2.87%. Analysts added that there are concerns regarding an additional slug of supply from Iran at a time when the market is trying to find its base while the pandemic still rages in key oil importing nations like India.
Opportunities
- U.S. Department of Agriculture Secretary, Tom Vilsack, reported that the department is testing approaches to expand sales of carbon offsets by U.S. farmers as part of the Biden administration’s climate initiatives. He added that the carbon markets have a mismatch, as only 2% of offsets sold in the U.S. are generated by the agriculture sector even though it accounts for almost 10% of the country’s greenhouse gas emissions. The Department of Agriculture released a report this week describing its climate change strategy which included adjusting existing conservation programs, better tools to measure climate impact and increased efforts to control forest fires. It is also considering options to boost carbon markets by setting standards to reduce transaction costs, technical assistance and supporting prices, which could mean that the department hosts reverse auctions and bids on carbon credits.
- Neste Oyj, the world’s largest producer of renewable diesel, reported that it is creating a new market for sustainable aviation fuel (SAF) as passengers return to the skies. The Finland-based company is planning on investing around $230 million at its Rotterdam renewables refinery to increase production of SAF, and with a planned expansion at its Singapore facility, it will produce 1.5 million tons of SAF a year by the end of 2023, increasing from 100,000 tons currently. SAF, which is made from waste and residues like cooking oil and animal fat, cuts carbon emissions by as much as 80% compared to regular fossil-based kerosene. Finnair is among one of the airlines and airports that buy the fuel directly from Neste.
- Rusal, the Russia-based aluminum producer, announced plans to de-merge its high-carbon-emitting assets, which include five smelters, four refineries and two mines. The company, which is one of the world’s largest producers of the lightweight metal, said that these plans will help it reach targets to reduce emissions by 35% by 2030 and hit net-zero emissions by 2050. Rusal will retain 12 modern smelters and several refineries and mines. The company’s operations benefit from an abundance of cheap and clean hydropower, and it is developing its own inert anodes to fully decarbonize its smelting operations.
Threats
- Australia-based BHP Group announced the start of production at its $3.5 billion South Flank project in Australia, creating the world’s largest iron ore hub. This announcement, coupled with the Chinese cabinet’s efforts to curb the soaring prices in the commodity markets is expected to temporarily cool the rally in iron ore futures. China’s cabinet meeting this week, chaired by Premier Li Keqiang, called for increased efforts to curb unreasonable gains, and prevent spillover on consumer prices, while also cracking down on speculation and hoarding. Iron ore futures have already dropped by more than 10% this week on the backdrop of these announcements.
- Brazil, which is the world’s biggest exporter of coffee, sugar, and oranges, is facing a drought which could push prices of these products higher. The soil in the South-Central region of the country, which is its agricultural powerhouse, is parched and river levels are lower than usual. Brazilian farmers are concerned that they will run out of water reserves that help keep crops alive over the country’s dry season as they have been using it to irrigate during the current rainy season, which has hardly brought any rain. The nation’s coffee and orange output are set to decline for a second year in a row, with its current orange crop shrinking 31% from the previous season, accounting for the biggest drop in 33 years. Coffee and raw-sugar contracts on the ICE Futures Exchange in New York reached four-year highs, and concerns about higher food prices exacerbating hunger in the world have increased, as the COVID-19 pandemic has made the issue more acute.
- President Biden’s promise to achieve net-zero emissions in the energy sector might already be in jeopardy as at least eight of the largest utilities suppliers in the U.S. are in the process of building new gas plants, which gets others thinking about doing the same. A professor at Duke University who studies climate change commented on these plans, saying that the climate pledges from such companies seems like false advertising and that the nation should not be building gas infrastructure in 2020s and 2030s. The emissions from all the plants under consideration would reach 35 million metric tons of carbon dioxide. To offset emissions from their new facilities, Southern Energy, Dominion Energy and others plan to invest in technologies to capture and dispose of their emissions, but neither of these strategies have been implemented at scale and none of the companies have provided a timeline or budget for upgrading or transitioning their gas plants.
Airline Sector
Strengths
- The best performing airline stock for the week was Qantas, up 6.5%. Recent airline pricing data is showing an overall improvement in the sector. Pricing is now down 26% versus 2019 levels, versus being down 31% over the trailing six-week period. Fares for Memorial Day weekend and July 4 are both up year-over-year (+3% and +55%, on a current week basis, respectively).
- Southwest Airlines recently announced capacity increases that imply both bookings and demand is improving. Capacity growth for June will be down only 6% from 2019 levels, which is down from the previous forecast of down 11%. Capacity is down 20% for May versus 2019 levels, implying an increase of about 14% sequentially from May to June.
- Airline website visits by potential customers continue to accelerate, which means, of course, that bookings could follow. Visits are down by only 8% versus 2019 levels. Allegiant and JetBlue are now 18% and 21% above 2019 levels, respectively. Website visits for EU airlines improved slightly as well; -57% of 2019 levels, down from -61% more recently. Much of this improvement is related to the U.K.’s recent “green list” announcement, as both British Airways and Ryanair rose during the week.
Weaknesses
- The worst performing airline stock for the week was Sun Country Air, down 14.0%. The stock fell on news that large shareholder Apollo Global Management offered their shares in a secondary offering for $34.50 per share. In other news, as a result of the escalating Israel-Hamas conflict, U.S. airlines have cancelled flights to Tel Aviv. This follows comments by American earlier in the week that Tel Aviv was one of the most reliable, and strongest, international markets during the pandemic.
- International capacity growth remains sharply down from 2019 levels and has not exhibited any signs of improvement. U.S. to Atlantic region capacity is down 66% in the second quarter versus 2019, while U.S. to Pacific region capacity is down 76% in the second quarter versus 2019.
- Singapore Air reported earnings that were 63% below consensus (S$804 million versus a S$492 million consensus). The number of flights is still depressed in the region; only 24% of normal levels in April and could be only 32% of normal levels by July.
Opportunities
- Bank of America has a proprietary flight signal indicator that is used to forecast airline revenue. The indicator is currently showing an improvement to -18 from -46 last quarter. This is positive for airlines’ revenue outlook over the next six months.
- Delta has indicated that corporate travel could resume as both commercial offices and borders reopen. In fact, 80% of Delta’s corporate accounts are seeing increases in ticketing. An uptick in U.S. to European travel will be led by leisure, initially. Air Canada, in a recent conference, noted hopeful trends for the industry, pointing out that bookings are picking up for both the fourth quarter of this year and the first quarter of next year.
- U.S. airlines’ debt may peak in the first half as industry cash burn subsides with a recovery in domestic air travel. Summer domestic capacity could rise to 90% of 2019 levels with load factors improving, which supports profit and cash generation.

Threats
- Airlines worldwide are beginning to feel cost pressures. Maintenance costs are increasing along with hiring and training costs for new and recalled employees. Ground handling operations are also facing cost pressures.
- Ryanair has been successful in some of its legal challenges to aid provided by European states to their respective national carriers. However, while it remains to be seen what changes could happen from this development, one potential outcome may be additional slot concessions in Portugal, Amsterdam from TAP and KLM/Air France.
- Philippine Air is talking with lessors about reducing its fleet size and has said that it may file for Chapter 11 bankruptcy in the U.S. The company is apparently working on a prepackaged plan for bankruptcy.
Emerging Markets
Strengths
- The best performing country in emerging Europe for the week was the Czech Republic, gaining 3.3%. The best performing country in Asia this week was India, gaining 3.7%.
- The Hungarian forint was the best performing currency in emerging Europe this week, gaining 2%. The Taiwanese dollar was the best performing currency in Asia this week, gaining 0.26%.
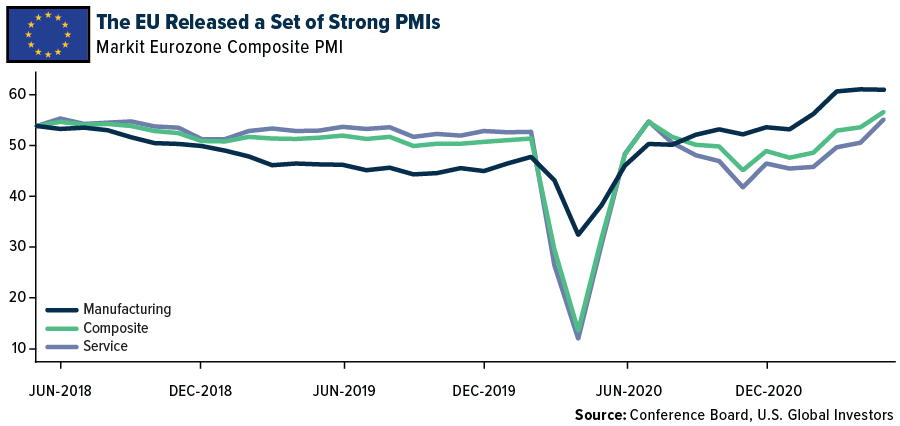
- The EU released a set of strong PMI readings this week. The preliminary Service PMI jumped to 55.1 in May from 50.5 in April. The Manufacturing PMI was little change but stayed well above the 50 level that separates contraction from growth (62.8 in May versus 62.9 in April). The Composite PMI, that combines manufacturing and service activities, increased to 56.9 from 53.8, above the expected reading of 55.1.
Weaknesses
- The worst relative performing country in emerging Europe for the week was Russia, gaining 0.6%. The worst performing country in Asia this week was Indonesia, losing 2.7%.
- The Czech koruna was the worst relative performing currency in emerging Europe this week, gaining 0.25%. The Indonesia rupiah was the worst performing currency in Asia, losing 0.62%.
- Some Asian countries are experiencing increasing numbers of COVID-19 cases and implementing more restrictive measures. Malaysia will impose a full lockdown in Ipoh, the country’s fourth-largest city, for two weeks from Saturday. Ministers are debating a full country lockdown after recording a high number of new cases. Taiwan raised its restriction level to three for the entire country. Bloomberg reported that the Philippines is at risk of being Asia’s laggard in its battle against the pandemic.
Opportunities
- Goldman Sachs expects strong sequential growth out of central emerging countries on the back of an improving pandemic situation and the economy reopening. The group maintains its consensus view on growth in the central emerging Europe (CEE) region and estimates average growth at 5.1% in 2021. The strongest growth is expected in Romania at 8.5% and Hungary at 7.1%, followed by the Czech Republic and Poland at 3.3% and 4%, respectively (despite a poor COVID situation in Poland and the Czech Republic in the first quarter).
- The Cornerstone Macro research team believes that the Eurozone will have a strong 2021 finish, with the service sector contributing the most to the region’s growth (73% of GDP) and manufacturing remaining strong, contributing almost 17% of GDP. Eurozone real GDP will likely grow 6% year-over-year in 2021. Tourist destination nations such as France, Italy, Spain, and Greece will also do well. This week Greece lifted its quarantine requirement for travelers from the European Union, provided they have been fully vaccinated or test negative for COVID-19 over the previous 72 hours.
- China is pushing ahead with behind-the-scenes talks to join the Comprehensive and Progressive Transit Pacific Partnership. During Barack Obama’s presidency, the Trans-Pacific Partnership was envisioned by the U.S. as an economic bloc that would balance China’s growing balance. Former President Donald Trump pulled out of the deal in 2017, with Japan leading the revised and renamed pact, to a successful conclusion in the following year.
Threats
- The worst is yet to come for Chinese technology companies, Bloomberg Intelligence reported this week. Heavy positioning may be the biggest headwind for these technology stocks as fundamentals are weakening. Downward consensus revisions have intensified across the board and there is growing regulatory pressure on these tech giants.
- The European Parliament froze the EU-China investment deal until China lifts sanctions that were imposed on EU politicians. The sanctions were imposed by China in retaliation of EU sanctions on persons and entities connected to human rights abuses in Xinjiang. The EU will also step-up coordination with the U.S. Europe may be moving away from China and looking to the U.S. for a more friendly trade relationship.
- Russia is experiencing unusually high temperatures in the Arctic. Most of the companies that operate there have their facilities built on permafrost, so much warmer weather so early in the year could lead to land changes. Last year Norilsk Nickel reported a spill of diesel fuel. It was originally speculated that the spill was due to the permafrost melting under the foundation of the reservoir, from which 21,000 tons of fuel leaked.
Leaders and Laggards

Download PDF 

U.S. Global Investors, Inc. is an investment adviser registered with the Securities and Exchange Commission ("SEC"). This does not mean that we are sponsored, recommended, or approved by the SEC, or that our abilities or qualifications in any respect have been passed upon by the SEC or any officer of the SEC.
This commentary should not be considered a solicitation or offering of any investment product. Certain materials in this commentary may contain dated information. The information provided was current at the time of publication. Some links above may be directed to third-party websites. U.S. Global Investors does not endorse all information supplied by these websites and is not responsible for their content. All opinions expressed and data provided are subject to change without notice. Some of these opinions may not be appropriate to every investor.
Holdings may change daily. Holdings are reported as of the most recent quarter-end. The following securities mentioned in the article were held by one or more accounts managed by U.S. Global Investors as of (03/31/2021):
Qantas Airways Ltd
Southwest Airlines
Allegiant Travel Co
JetBlue Airways
American Airlines
Singapore Airlines
Delta Air Lines
Air Canada
Norilsk Nickel
Tesla Inc
Anglo American PLC
Centerra Gold Inc
Arizona Metals Corp
Newmont Corp
AngloGold Ashanti Ltd
*The above-mentioned indices are not total returns. These returns reflect simple appreciation only and do not reflect dividend reinvestment. The Dow Jones Industrial Average is a price-weighted average of 30 blue chip stocks that are generally leaders in their industry. The S&P 500 Stock Index is a widely recognized capitalization-weighted index of 500 common stock prices in U.S. companies. The Nasdaq Composite Index is a capitalization-weighted index of all Nasdaq National Market and SmallCap stocks. The Russell 2000 Index® is a U.S. equity index measuring the performance of the 2,000 smallest companies in the Russell 3000®, a widely recognized small-cap index. The Hang Seng Composite Index is a market capitalization-weighted index that comprises the top 200 companies listed on Stock Exchange of Hong Kong, based on average market cap for the 12 months. The Taiwan Stock Exchange Index is a capitalization-weighted index of all listed common shares traded on the Taiwan Stock Exchange. The Korea Stock Price Index is a capitalization-weighted index of all common shares and preferred shares on the Korean Stock Exchanges. The Philadelphia Stock Exchange Gold and Silver Index (XAU) is a capitalization-weighted index that includes the leading companies involved in the mining of gold and silver. The U.S. Trade Weighted Dollar Index provides a general indication of the international value of the U.S. dollar. The S&P/TSX Canadian Gold Capped Sector Index is a modified capitalization-weighted index, whose equity weights are capped 25 percent and index constituents are derived from a subset stock pool of S&P/TSX Composite Index stocks. The S&P 500 Energy Index is a capitalization-weighted index that tracks the companies in the energy sector as a subset of the S&P 500. The S&P 500 Materials Index is a capitalization-weighted index that tracks the companies in the material sector as a subset of the S&P 500. The S&P 500 Financials Index is a capitalization-weighted index. The index was developed with a base level of 10 for the 1941-43 base period. The S&P 500 Industrials Index is a Materials Index is a capitalization-weighted index that tracks the companies in the industrial sector as a subset of the S&P 500. The S&P 500 Consumer Discretionary Index is a capitalization-weighted index that tracks the companies in the consumer discretionary sector as a subset of the S&P 500. The S&P 500 Information Technology Index is a capitalization-weighted index that tracks the companies in the information technology sector as a subset of the S&P 500. The S&P 500 Consumer Staples Index is a Materials Index is a capitalization-weighted index that tracks the companies in the consumer staples sector as a subset of the S&P 500. The S&P 500 Utilities Index is a capitalization-weighted index that tracks the companies in the utilities sector as a subset of the S&P 500. The S&P 500 Healthcare Index is a capitalization-weighted index that tracks the companies in the healthcare sector as a subset of the S&P 500. The S&P 500 Telecom Index is a Materials Index is a capitalization-weighted index that tracks the companies in the telecom sector as a subset of the S&P 500. The NYSE Arca Gold Miners Index is a modified market capitalization weighted index comprised of publicly traded companies involved primarily in the mining for gold and silver. The Consumer Price Index (CPI) is one of the most widely recognized price measures for tracking the price of a market basket of goods and services purchased by individuals. The weights of components are based on consumer spending patterns. The Purchasing Manager’s Index is an indicator of the economic health of the manufacturing sector. The PMI index is based on five major indicators: new orders, inventory levels, production, supplier deliveries and the employment environment. The S&P/TSX Venture Composite Index is a broad market indicator for the Canadian venture capital market. The index is market capitalization weighted and, at its inception, included 531 companies. A quarterly revision process is used to remove companies that comprise less than 0.05% of the weight of the index, and add companies whose weight, when included, will be greater than 0.05% of the index. Gross domestic product (GDP) is the monetary value of all the finished goods and services produced within a country’s borders in a specific time period, though GDP is usually calculated on an annual basis. It includes all of private and public consumption, government outlays, investments and exports less imports that occur within a defined territory.
The Bloomberg Commodity Index is made up of 22 exchange-traded futures on physical commodities. The index represents 20 commodities, which are weighted to account for economic significance and market liquidity. The Prices paid index is an index that measures changes in the prices paid for goods and services used in crop and livestock production and family living. The U.S. dollar index (USDX) is a measure of the value of the U.S. dollar relative to the value of a basket of currencies of the majority of the U.S.’s most significant trading partners. M2 is a measure of the money supply that includes cash, checking deposits, and easily convertible near money. The Citi Economic Surprise Index measures the pace at which economic indicators are coming in ahead of or below consensus forecasts. When the index is negative, it means that the majority of reports are coming in below expectations, while a positive reading indicates that most data is coming in ahead of expectations.
