A Gold Correction Was Expected After Nine Straight Weeks of Gains
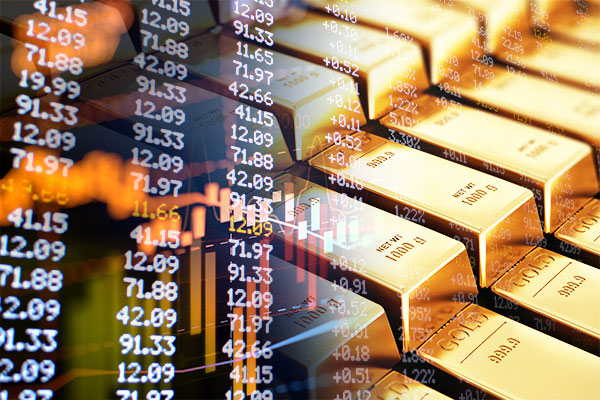
The price of gold had its first down week since early June, ending a spectacular nine-week rally, the likes of which we haven't seen since 2006.

The price of gold had its first down week since early June, ending a spectacular nine-week rally, the likes of which we haven’t seen since 2006. The yellow metal briefly fell below $1,900 an ounce last Wednesday as stocks neared their all-time closing high and the 10-year Treasury yield jumped on record supply. Wednesday’s $38 billion auction of 10-year government bonds was the largest in U.S. history.
As I shared with you last month, gold was looking overbought at more than two standard deviations, so a short-term correction was to be expected.
It’s important to keep in mind, though, that the metal’s long-term drivers remain intact. We have unprecedented monetary and fiscal stimulus, with more potentially on the way. There’s still trillions of dollars’ worth of global government debt trading with a negative yield.
Despite the correction, gold continues to trade in a golden cross. That’s when the average price for the past 50 trading days is above the average price for the past 200 trading days, and it’s typically seen as a bullish signal. The current golden cross has been in place for more than 18 months now.
To learn more about the golden cross, watch the video below. Be sure to wait until the very end of the video so you can subscribe to our channel. You can also go directly to our YouTube channel and subscribe by clicking here.
Where’s the Inflation?
I believe the one factor that’s missing from this bull run is inflation. Since the financial crisis, we really haven’t seen a significant change in consumer prices, if we’re using the Bureau of Labor Statistics’ (BLS) gauge.
We may be on the verge of a new inflationary period, however, based on the latest report by the BLS. On a month-over-month basis, core inflation—that’s inflation on all items excluding volatile food and energy prices—rose 0.6 percent in July. That may not sound like much, but it’s the biggest such increase since 1991.
According to the bureau, the monthly change was led by a sharp rise in auto insurance prices. Other increases were seen in shelter, communication, medical care and used cars and trucks.
Historically, inflation has been constructive for the gold price. As the purchasing power of the dollar falls, savers and investors may seek other, more reliable stores of value, including the yellow metal.
Wheaton Precious Reports Record Revenue
If you remember, we accurately called the market bottom in a March YouTube video, using our own U.S. Global Sentiment Indicator, which tracks 126 commodities, emerging market equity indices and other assets. The indicator fell to an all-time low on March 18, flashing a strong buy signal. Interestingly, we shot the video on the last day we were in the office before making the decision to work from home.
In case you missed it, you can watch the video below.
Around the same time in mid-March, I also predicted that precious metal mining companies would see some very attractive revenue and cash flow generation in the coming months due to higher metal prices.
Not all explorers and producers in the investable universe have reported second-quarter earnings yet, but those that have are sharing strong results. Royalty firm Franco-Nevada reported $91.8 million in net income, an increase of 43 percent from the same quarter a year earlier, on revenue of $195.4 million. Franco received a Buy rating from Raymond James following the earnings report, with analyst Brian MacArthur writing that the company “has a strong balance sheet to finance potential future deals and support its dividend, which has increased every year.” The company continues to be debt-free.
Fellow royalty and streaming company Wheaton Precious Metals also had a blowout quarter. The company reported $105.8 million in net income, substantially beating Wall Street estimates of around $80 million. Revenue also beat for the quarter, and in fact, Wheaton generated record revenue for the first half of the year. Total revenue was more than $503 million, an increase of 21 percent over the same six-month period in 2019.
During the earnings call, Wheaton President and CEO Randy Smallwood expressed optimism in the company’s growth prospects, the pandemic notwithstanding.
“Given the bullish precious metals markets, the strength of our business model and our high-quality portfolio of assets, we remain confident that we can continue to create sustainable value for our stakeholders. Not only that, but we remain optimistic that we will be able to continue growing the company and add additional production from long-life assets producing in the lowest half of their respect cost curves,” Randy said.
Improved China PMI Lifts Oil
Crude oil hit a post-pandemic high last week, rising to nearly $43 a barrel on Wednesday as domestic crude supply fell for a third straight week. Consumption has also improved in China, where manufacturing activity continues to expand following countrywide lockdowns. The official China manufacturing purchasing manager’s index (PMI) ticked up to 51.1 in July, representing the fifth straight month the gauge has been above the 50.0-line separating expansion from contraction. The private Caixin/Markit PMI, meanwhile, came in even higher at 52.8.
As I’ve pointed out many times before, PMI is a forward-looking indicator that can help investors get a sense of where commodity prices might be headed one to six months down the road. That’s because one of the things PMI looks at is new orders. If factories are receiving a wave of new orders for, say, automobiles, you can reasonably expect that they will need to consume more energy to run their operations, not to mention use more metals and other raw materials.
All of this activity is supportive of commodity prices—oil’s especially, based on China’s PMI data above.
Our own research has found that when the JPMorgan Global Manufacturing PMI crossed above its three-month moving average, materials, energy, copper and crude oil prices were higher on average three months later.
I explain the relationship between PMI and commodity prices further in the following YouTube video.
Ethereum and HIVE Continue to Trade in Tandem
On a final note, cryptocurrencies have been on fire the past 30 days. Ethereum, the world’s second-largest digital coin after bitcoin, has skyrocketed 83.5 percent since July 14 and 304.4 percent since its 52-week low on March 16. On Friday, it was trading safely above $400 for the first time in two years.
This has sent Ethereum transaction fees to an all-time high. The average fee to send and receive the digital currency stood at around $6.45 on August 13, well above the 12-month average of $0.38.
Shares of HIVE Blockchain Technologies, the world’s first publicly traded crypto miner, traded up on Friday and were on track to notch its second straight month of positive gains, after rising 51 percent in July. As I shared with you recently, HIVE and Ethereum have historically traded in tandem. For the two-year period, the two have a moderately strong correlation coefficient of 0.56. A coefficient of 1 means two assets invariably trade in the same direction at the same time while a coefficient of -1 means that they have a negative relationship and trade in opposite directions at the same time.
I’m sure you’ve noticed we ramped up our educational video content. To receive an update each time we publish a new video, subscribe to our YouTube channel by clicking here. Happy Investing!
All opinions expressed and data provided are subject to change without notice. Some of these opinions may not be appropriate to every investor. By clicking the link(s) above, you will be directed to a third-party website(s). U.S. Global Investors does not endorse all information supplied by this/these website(s) and is not responsible for its/their content.
The Consumer Price Index (CPI) is one of the most widely recognized price measures for tracking the price of a market basket of goods and services purchased by individuals. The weights of components are based on consumer spending patterns. The Purchasing Manager’s Index is an indicator of the economic health of the manufacturing sector. The PMI index is based on five major indicators: new orders, inventory levels, production, supplier deliveries and the employment environment.
Frank Holmes has been appointed non-executive chairman of the Board of Directors of HIVE Blockchain Technologies. Both Mr. Holmes and U.S. Global Investors own shares of HIVE. Effective 8/31/2018, Frank Holmes serves as the interim executive chairman of HIVE.
Holdings may change daily. Holdings are reported as of the most recent quarter-end. The following securities mentioned in the article were held by one or more accounts managed by U.S. Global Investors as of (06/30/2020): Franco-Nevada Corp., Wheaton Precious Metals Corp.
